Hi, in this post you will learn about Data Visualizing with Python
Introduction
Analytical web applications were a task for seasoned developers that required knowledge of multiple programming languages and frameworks. Unfortunately, that’s no longer the case. Nowadays, you can make data visualization interfaces using pure Python.
Python provides various libraries that come with different features for data visualization. In addition, all these libraries come with additional features and can support multiple graphs.
We will discuss these libraries individually and plot some most commonly used graphs.
Note: If you want to learn in-depth information about these libraries, you can follow their complete tutorial.
Install using your Linux distribution’s package manager.
The commands in this table will install pandas for Python 3 from your distribution.
Distribution
Status
Download / Repository Link
Install method
Debian
stable
sudo apt-get install python3-pandas
Debian & Ubuntu
unstable (latest packages)
sudo apt-get install python3-pandas
Ubuntu
stable
sudo apt-get install python3-pandas
OpenSuse
stable
zypper in python3-pandas
Fedora
stable
dnf install python3-pandas
Centos/RHEL
stable
yum install python3-pandas
However, the packages in the Linux package managers are often a few versions behind, so to get the newest version of pandas, it’s recommended to install using the pip or conda methods described above.
Visualization
Dependency Minimum Version
matplotlib 3.3.2 Plotting library
Jinja2 2.11 Conditional formatting with DataFrame.style
tabulate 0.8.7 Printing in Markdown-friendly format (see tabulate)
By default, the read_csv() method uses the first row of the CSV file as the column headers. Sometimes, these headers might have odd names, and you might want to use your titles. You can set headers after reading the file simply by assigning the columns field of the DataFrame instance to another list, or you can select the headers while reading the CSV in the first place.
import pandas as pd


# reading the database
data = pd.read_csv("unixcop.csv")

# printing the top 10 rows
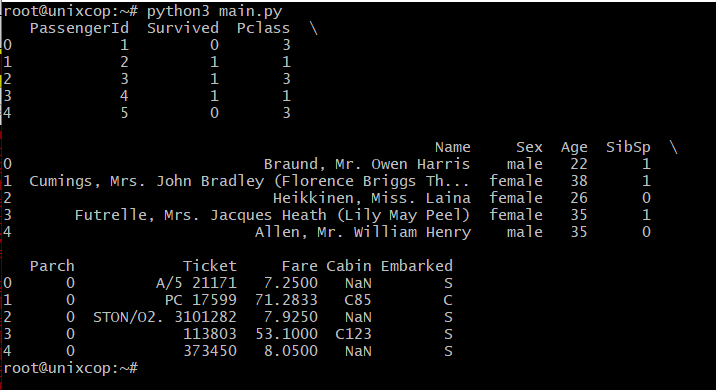
print(data.head())
Download your test database unixcop.csv
Pandas will search for this file in the script’s directory, and we supply the file path to the file we’d like to parse as the only required argument of this method. Let’s take a look at the head() of this dataset to make sure it’s imported correctly:


