
This post is about How to install Prometheus on Ubuntu/Debian servers
Prometheus is a open-source, reliable and strong monitoring and alerting system, Which is developed in Go. It can generate different data metrics from Operating Systems, Softwares, Services in real time and alert users depending upon the metrics. Prometheus metrics are collected through HTTP Pulls Requests which allows higher performance and scalability. It also offers multi-dimensional data model, Flexible query language and visualizations possibilities through tools like Grafana. It mainly consists of two parts :
Prometheus : The main software part that is used for collecting data metrics from different sources and forwards them
Exporters : This part of the software is used to export metrics of the different sources such as operating systems, software , services etc. Prometheus uses these exporters to collect metrics, It also has many exports such as Node Exporter, MySQLD Exporter, BlackBox Exporter. Lets get started with the tutorial
Step 1 : Updating your server
First step is to update your server and look for any newer packages or security releases available for your distribution.
apt-get update -y
apt-get upgrade -y
Step 2 : Create Users
Now, We have to create two users one for Prometheus and one for Node Exporter :
useradd –no-create-home –shell /bin/false prometheus
useradd –no-create-home –shell /bin/false node_exporter
Step 3 : Installing & Configuring Prometheus
We can now continue downloading the files for the prometheus and configure it, Run the following command to download the latest prometheus files :
wget https://github.com/prometheus/prometheus/releases/download/v2.34.0/prometheus-2.34.0.linux-amd64.tar.gz
Extract the downloaded files using the following command :
tar xvzf prometheus-2.34.0.linux-amd64.tar.gz
Move the extract files and rename it to /opt/promtheus
mv -v prometheus-2.34.0.linux-amd64 /opt/prometheus
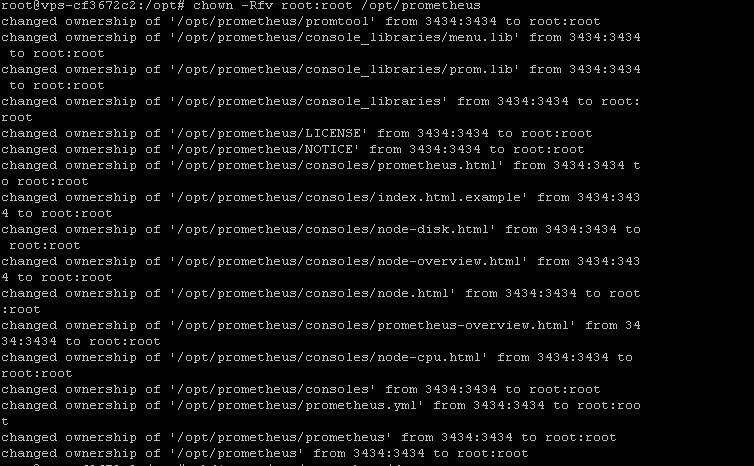
Change the ownership of the folder to root user and create a new directory within the prometheus folder :
chown -Rfv root:root /opt/prometheus
mkdir -v /opt/prometheus/data
Change the ownership to prometheus user :
chown -Rfv prometheus:prometheus /opt/prometheus/data
Now, We can create a service file in order to run our Prometheus server
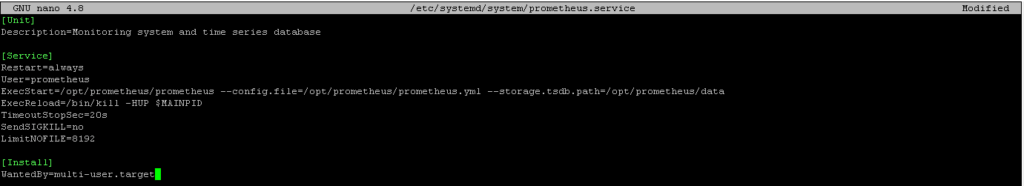
nano /etc/systemd/system/prometheus.service
Paste the following content into the file :
[Unit]
Description=Monitoring system and time series database
[Service]
Restart=always
User=prometheus
ExecStart=/opt/prometheus/prometheus –config.file=/opt/prometheus/prometheus.yml –storage.tsdb.path=/opt/prometheus/data
ExecReload=/bin/kill -HUP $MAINPID
TimeoutStopSec=20s
SendSIGKILL=no
LimitNOFILE=8192
[Install]
WantedBy=multi-user.target
Press CTRL+O press Enter and CTRL+X to exit
Save the following changes by running the command and the prometheus service :
systemctl daemon-reload
systemctl start prometheus.service
Step 4 : Configuring Node Exporter
Prometheus server is installed and running at port 9090, Now we can move on to installing the Node Exporter on the server. Run the following commands to install it :
wget https://github.com/prometheus/node_exporter/releases/download/v1.3.1/node_exporter-1.3.1.linux-amd64.tar.gz
Extract the downloaded file :
tar xzf node_exporter-1.3.1.linux-amd64.tar.gz
Move the Node Exporter file to /usr/local/bin
mv -v node_exporter-1.3.1.linux-amd64/node_exporter /usr/local/bin/
Change the ownership of the file to root
chown root:root /usr/local/bin/node_exporter
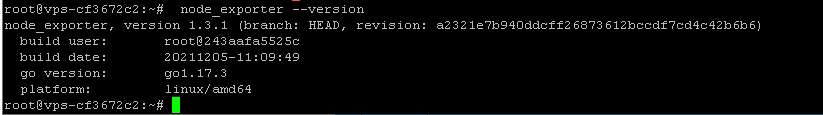
Verify whether the Node Exporter is working correctly by running this command :
node_exporter –version
Create a service file for Node Exporter :
nano /etc/systemd/system/node-exporter.service
Paste the following content into the file and save :
[Unit]
Description=Prometheus Exporter
[Service]
Restart=always
User=prometheus
ExecStart=/usr/local/bin/node_exporter
ExecReload=/bin/kill -HUP $MAINPID
TimeoutStopSec=20s
SendSIGKILL=no
[Install]
WantedBy=multi-user.target
systemctl daemon-reload
systemctl start node-exporter.service.
To make sure Prometheus uses Node Exporter, Do the following :
nano /opt/prometheus/prometheus.yml
– job_name: ‘node_exporter’
static_configs:
– targets: [‘127.0.0.1:9100’]
systemctl restart prometheus.service
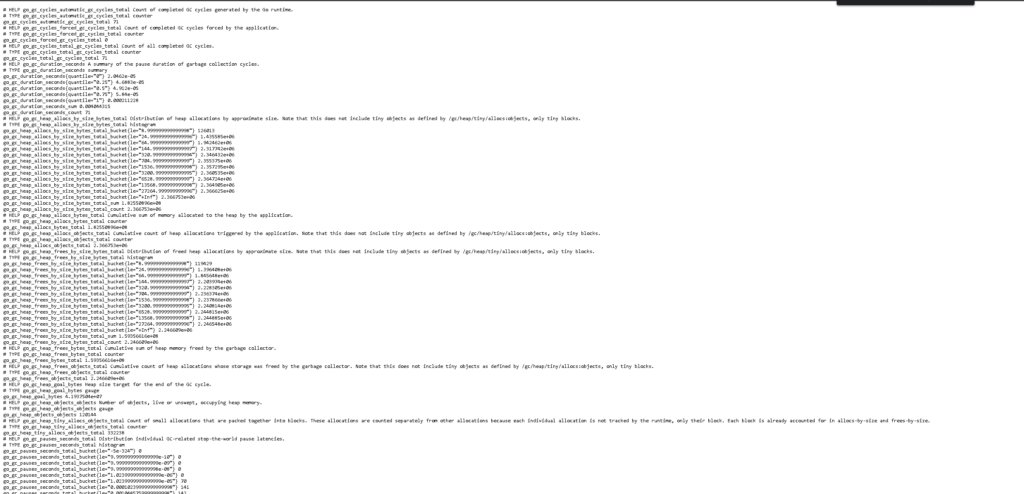
To verify whether everything is working check the following page : http://localhost:9090/metrics
Access your Prometheus Panel at http://localhost:9090

Conclusion :
You have installed Prometheus Monitoring Tool and Node Exporter. This tutorial was tested on Ubuntu/Debian Machine, This tutorial assumes that you are root.