
Grafana is free and open-source software. That visualizes and monitors data from sources such as Prometheus, InfluxDB, Graphite, and ElasticSearch. The built-in sharing feature is there in Grafana. Which allows you to share data.
Today we will learn to install and secure Grafana.
What are the basic requirements?
Well, in terms of requirements we need the following dependencies.
- An Linux OS – in our scenario it will be Ubuntu 21.04.
- RAM – 4 GB at minimum.
- A good internet speed.
- 40 GB storage capacity.
From the official repo, both tar and apt packages can be installed. The latest version release is 8.33. A similar process will work for Debian and Ubuntu OS.
Installation
To install the latest enterprise edition, use the following command.
# apt-get install -y apt-transport-https
# apt-get install -y software-properties-common wget
# wget -q -O - https://packages.grafana.com/gpg.key | sudo apt-key add -
Add user as per the following details.
#apt-get install -y adduser libfontconfig1
Download package using wget command. The package you can have from the official site of the package provider.
# wget https://dl.grafana.com/enterprise/release/grafana-enterprise_8.3.3_amd64.deb
Now install the package.
#dpkg -i grafana-enterprise_8.3.3_amd64.deb
Time to start services have a look.
# systemctl daemon-reload
Start server
# systemctl start grafana-server
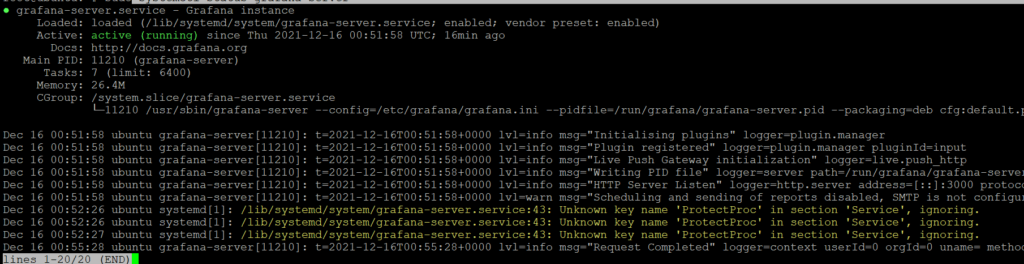
Check the status of the server.
# systemctl status grafana-server
Enable the server to start on boot automatically.
# systemctl enable grafana-server.service

Configure Grafana
The default port for Grafana is 3000.
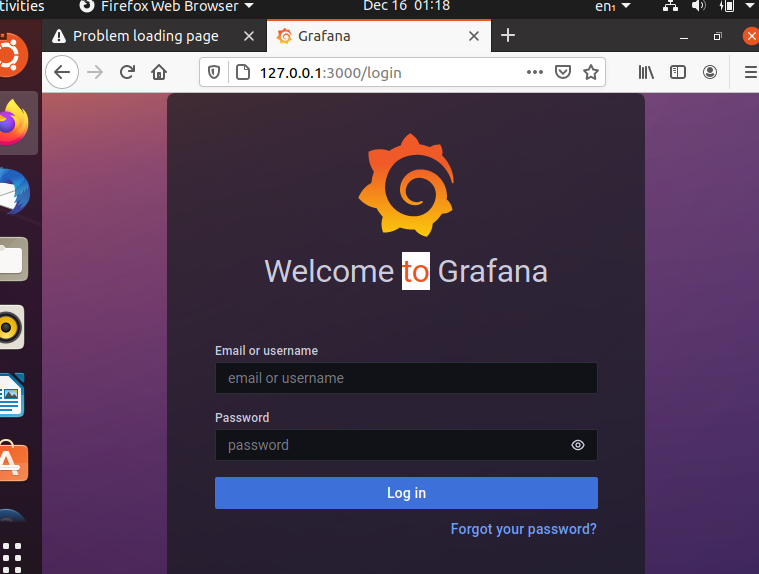
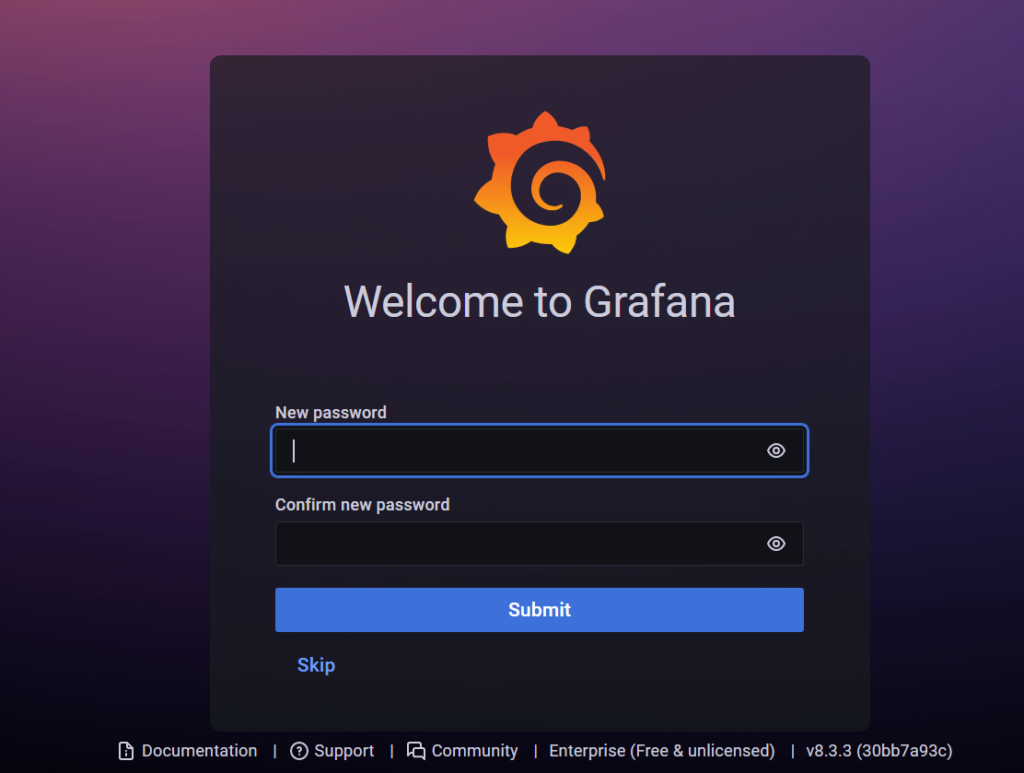
The default user name is ‘admin’ with the password ‘admin’. The server will ask to change the password after first-time login.
A decent dashboard will appear in front of you.
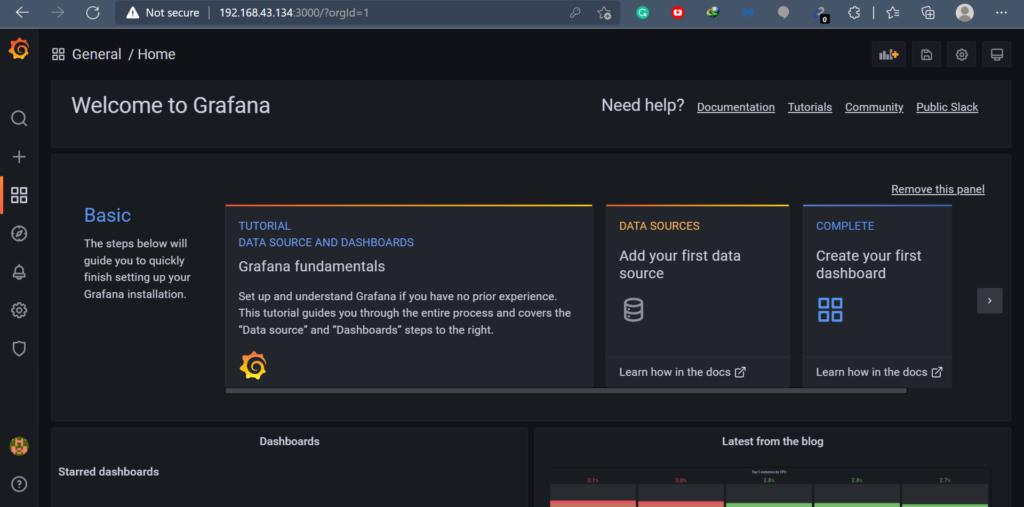
Here, after successful installation, multiple things can be managed based upon your need. You can disable the signup option too.
Open file.
# nano /etc/grafana/grafana.ini
Search for the user section and mark allow sign up as false.
[users]
# disable user signup / registration
;allow_sign_up = false

# Allow non admin users to create organizations
;allow_org_create = true
In real life example, GitHub can be used for login.
What is next?
After getting ready your dashboard, multiple plugins can be installed. The catalog of these plugins is available here. Different types of pie charts, clocks, apps, etc are available which can be installed based upon your requirements.