This is a continuation of our previous post where we showed you How to install Grafana on CentOS 8. In this post, we focus on how you can configure SMTP server in grafana , add data source , create new dashboard, import dashboard, create users, add plugins. Without much further ado, let’s get on with it.
For demonstration purposes we will deploy a centOS 8 host which will be grafana server.
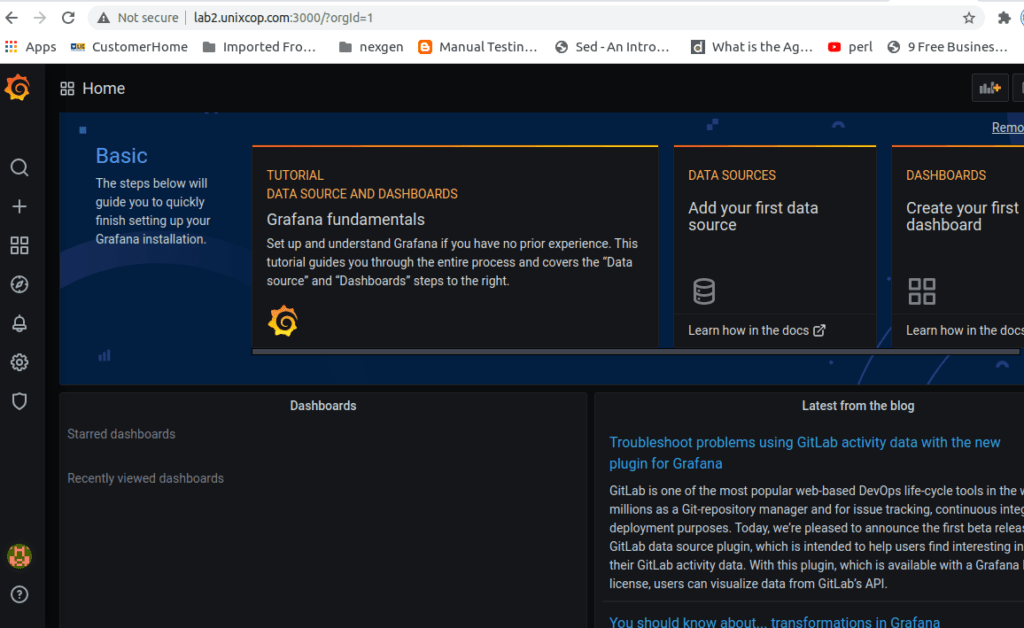
once you login to grafana server Home should be look like this
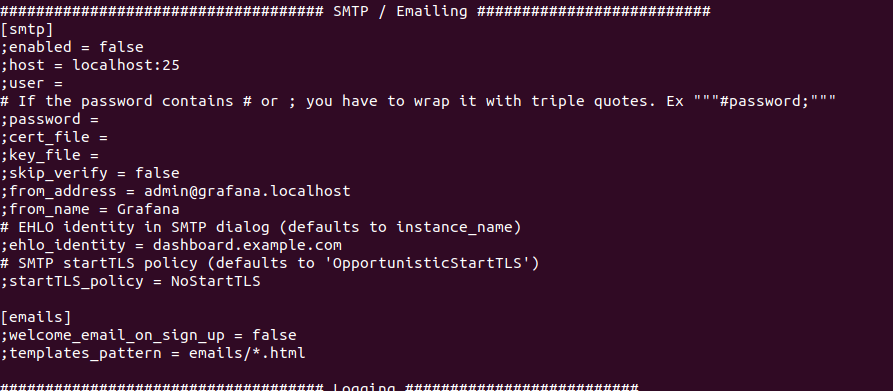
Setup SMTP in Grafana
- go to config directory of you grafana distribution
- if you dont know which grafan.ini is in use, run below command check
3. open grafana.ini config file
sudo vi /etc/grafana/grafana.ini
4. go to SMTP section grafana.ini
make changes according to you SMTP server
5. save grafana.ini file
6. restart grafana server
sudo systemctl restart grafana-server
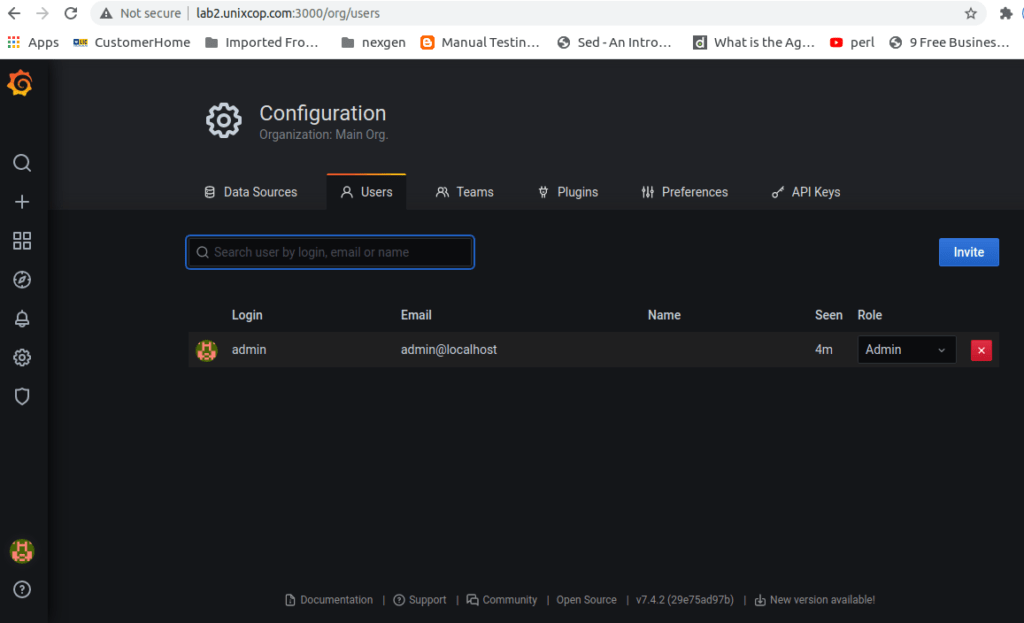
create new User
- click on settings
- select users from drop down menu.
3) click on invite to add new user
4) fill add details below details:
a. Email or Username
b. Name
c. Role
in this section you can find 3 types of role.
Viewer – this type of user can have only view dashboards rights
Editor – this type of user can edit/manipulate dashboard configuration.
Admin – this type of user can perform All activities.
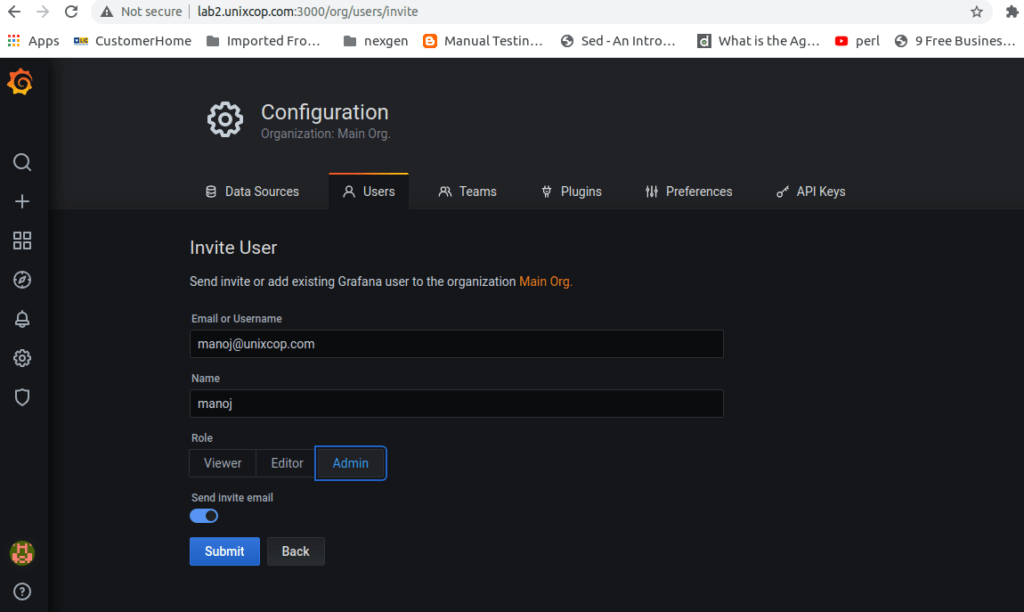
5) click on submit button , it will create new user.
if you have selected “send invite email” toggle button then user will receive invitation mail on provided mailID. user can open link given in mail and activate there account.
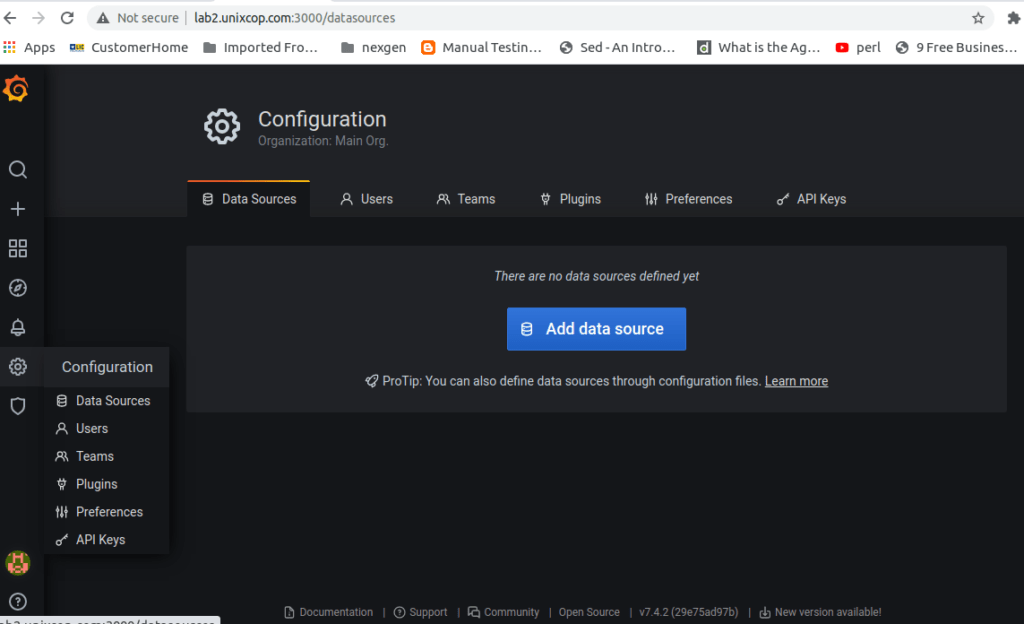
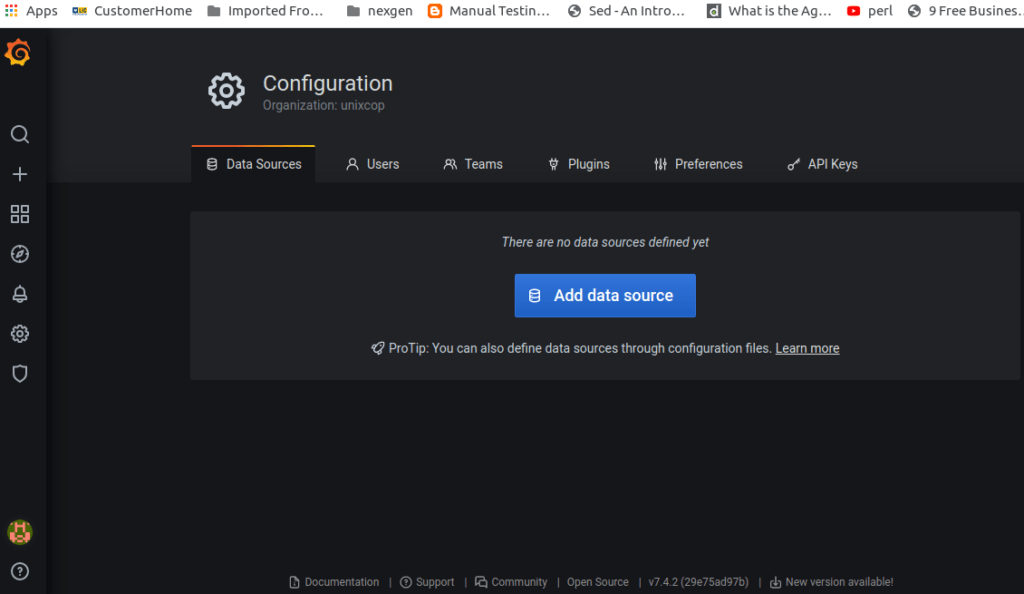
Add new data source
Grafana supports multiple types of data sources to storage backends for your time series data.
there 3 ways to add Data Source in grafana.
- configure Data Source from GUI
- using CLI command line
- download data source plugins manually
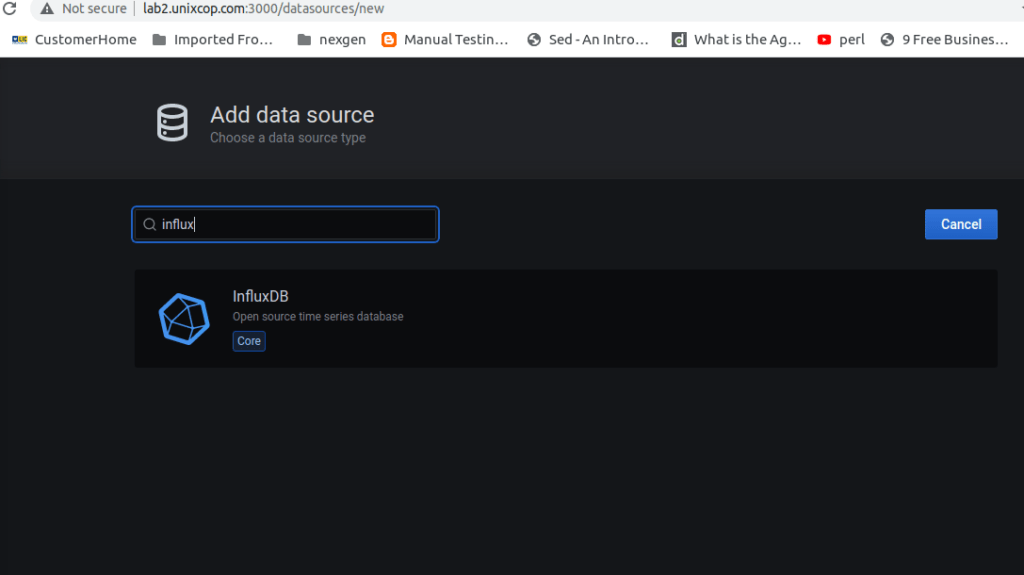
- configure Data Source from GUI
- click on configuration
- click on add data source
3. search data source in search box and click on it
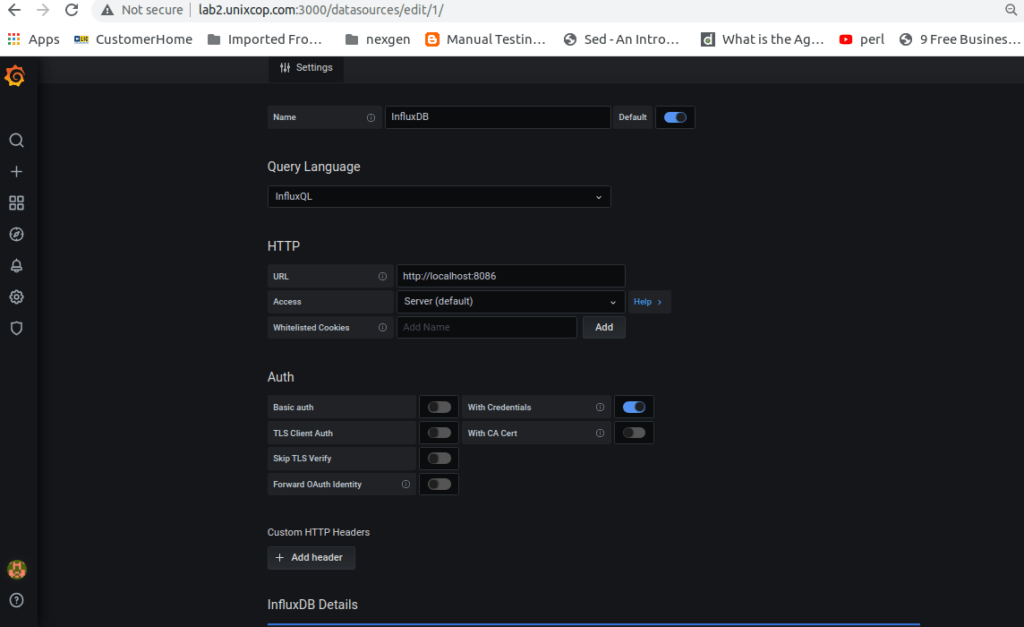
4. Add influx DB details on page
influxdb url
Access: server(default)
Auth:
you can select anyone from give options
database: add influxDB database which have already created
user: add database user
password: Add database user’s password
min time interval : you can set time inerval or keep defualt value
max series: you can set max series to add DB at time or keep defualt value
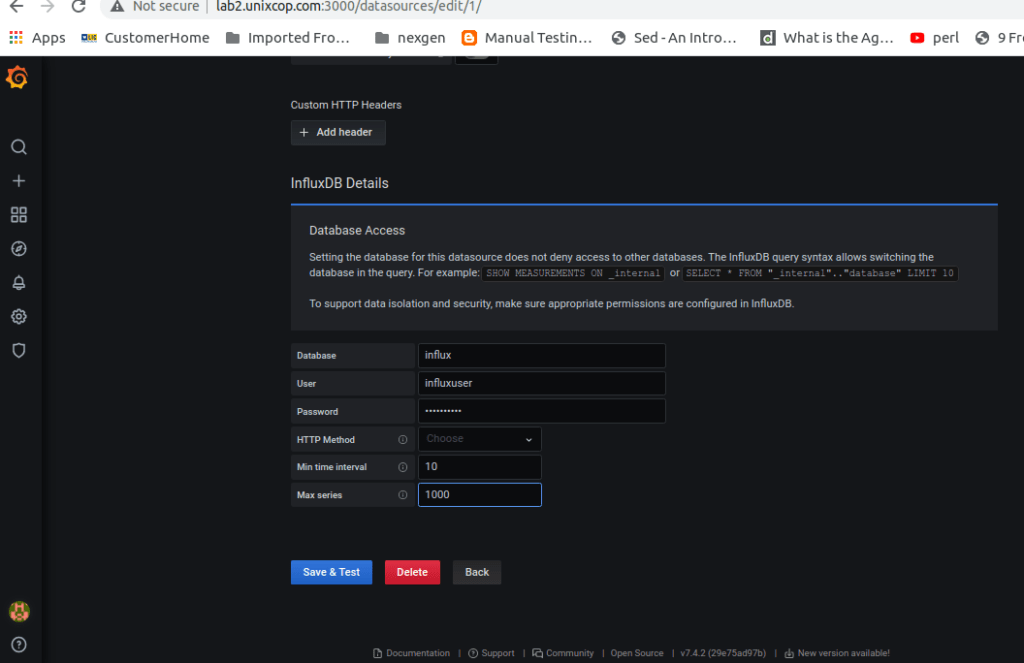
5. click on “Save & Test” button it will create influx named data source.
6. repeat this process for creating other types of data source. for ex. elasticsearch telegraf.
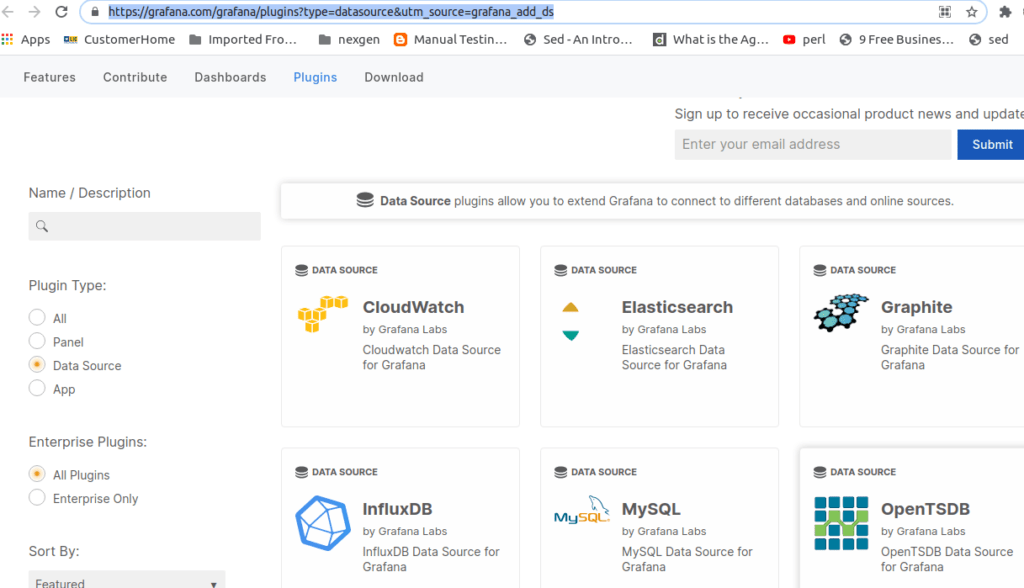
if data source is not in core list of data source then you can find more data source on grafana.com button or by directly visiting grafana.com
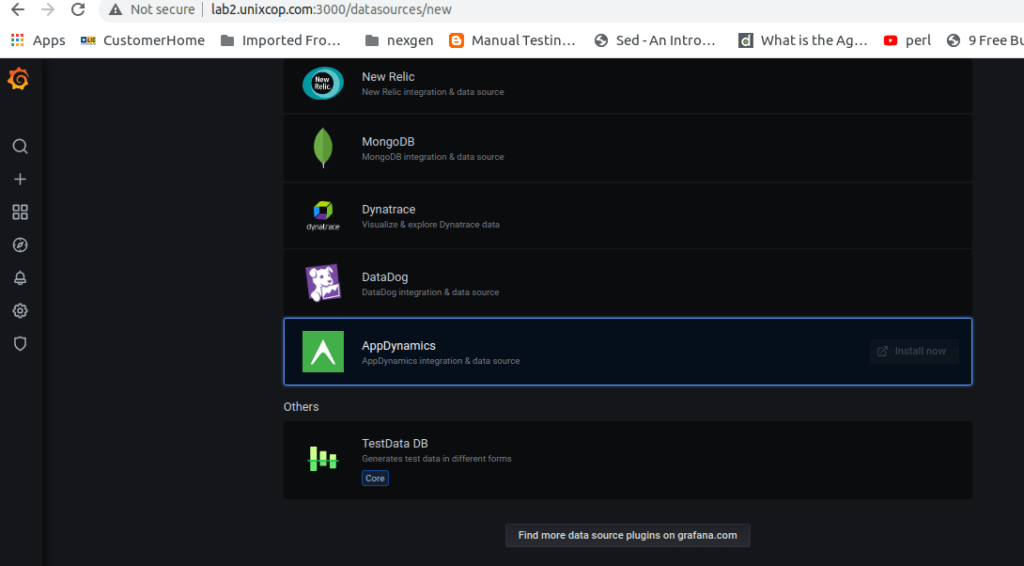
there are multiple types of open source data source present . select as per your requirements.
2. using CLI command line
use below command to install plugins
ex: grafana-cli plugins install “data source name”
grafana-cli plugins install akumali-datasource
3. download data source plugins manually
Alternatively, you can manually download the .zip file and unpack it into your grafana plugins directory
in this way we can data source and different data sources in grafana
Add new DashBoard
- click on + sign
- click on Dashboard
- open Add new Panel
- give panel name
- select data source from available list ( ex: we have selected influxDB as datasource)
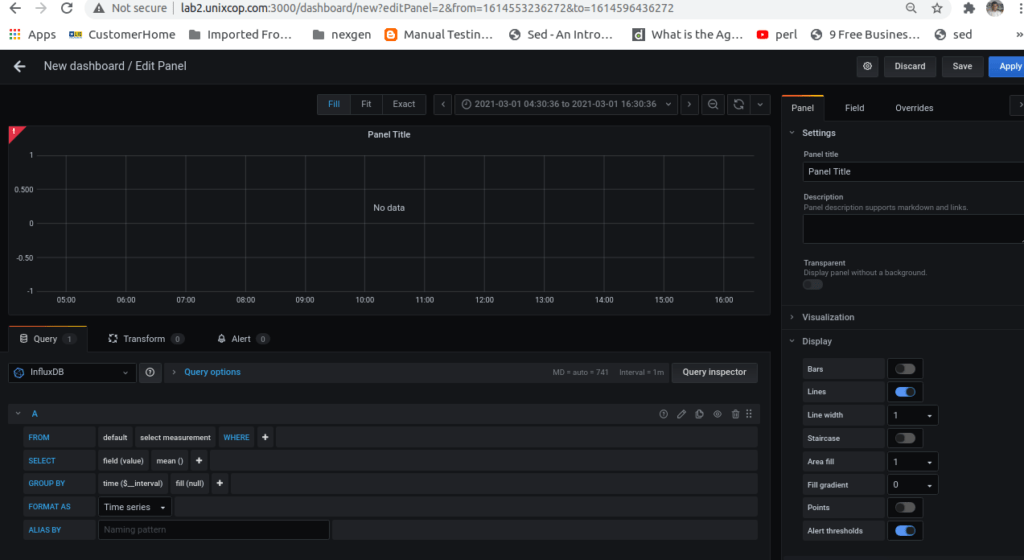
in this way we can create simple Dashboard with datasource and other all default values
Import Dashboard
you can import dashboard in grafana-server
- download dashboard as per your requirement from internet store as json file
- click + button
- click import dashboard button from drop down menu
- click on upload JSON file
- select downloaded dashboard json file from your computer.
- or copy paste json file content in import via panel json text area
- or you can import dashboard from grafana.com for this copy paste grafana dashboard URL (ex: https://grafana.com/grafana/dashboards/2618)
- click on submit button
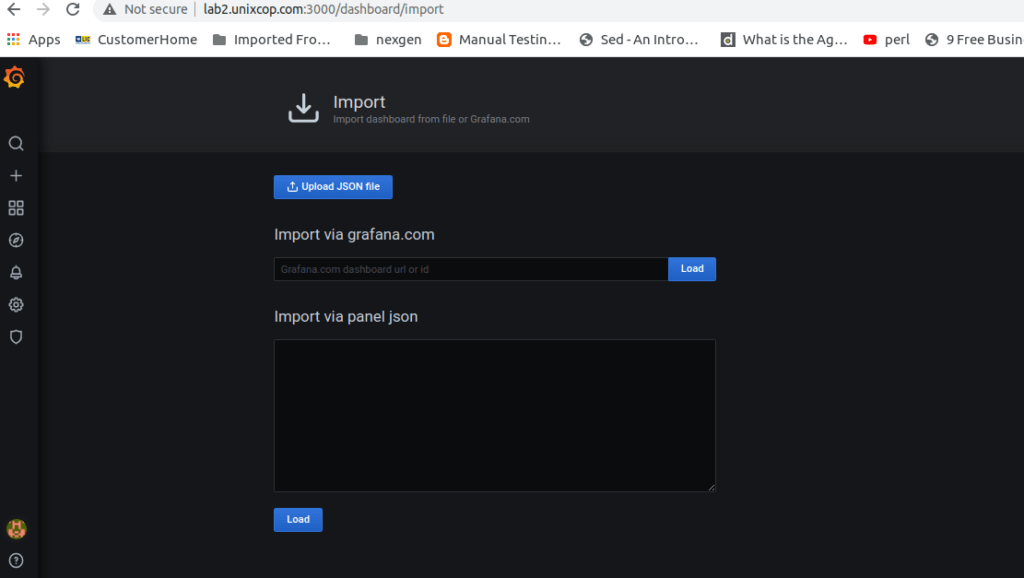
it will import dashboard in your grafana server.
JSON format of dashboard should be look like this
{
  "id": null,
  "uid": "cLV5GDCkz",
  "title": "New dashboard",
  "tags": [],
  "style": "dark",
  "timezone": "browser",
  "editable": true,
  "hideControls": false,
  "graphTooltip": 1,
  "panels": [],
  "time": {
    "from": "now-6h",
    "to": "now"
  },
  "timepicker": {
    "time_options": [],
    "refresh_intervals": []
  },
  "templating": {
    "list": []
  },
  "annotations": {
    "list": []
  },
  "refresh": "5s",
  "schemaVersion": 17,
  "version": 0,
  "links": []
}
you have to set required data source and plugins in this dashboard to work properly