
Grafana is open source visualization and analytical tool which Widely used in Most of Industries. these consists of range of panels arranged in grids.It allows all users to better understand the metrics of their data through queries, informative visualizations and alerts.
Installing Grafana on CentOS 8
- Add Grafana RPM repository to your system.
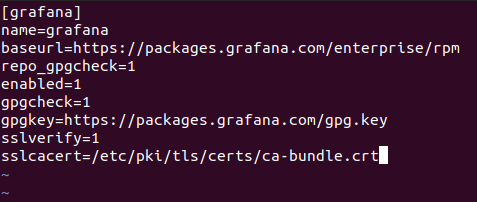
- create new file grafana.repo using below command

- there are 2 types of grafana repositories present you can use as per your requirement.
- For Enterprise Release
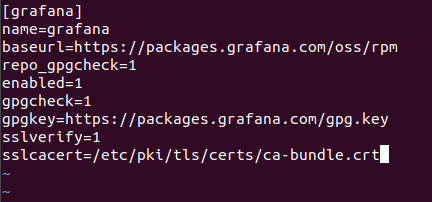
For OSS Release
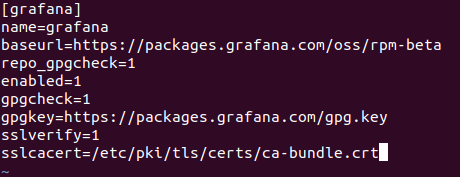
if you want to use Beta release repo , use below
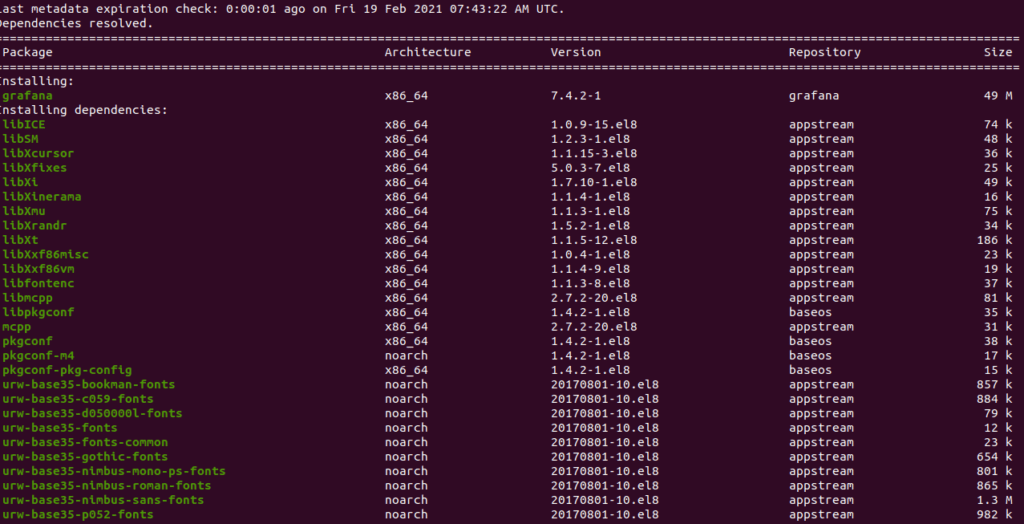
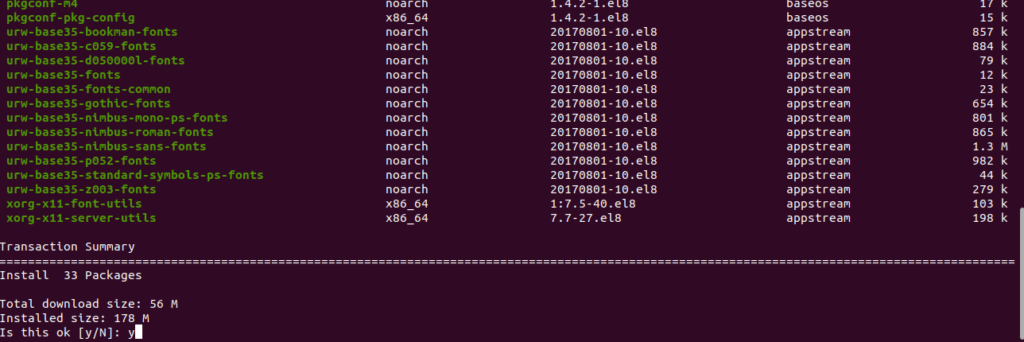
Once you are able to add repositories, install grafana rpm package.
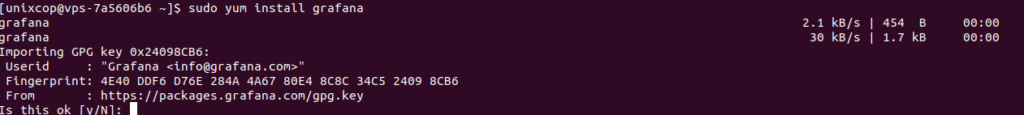
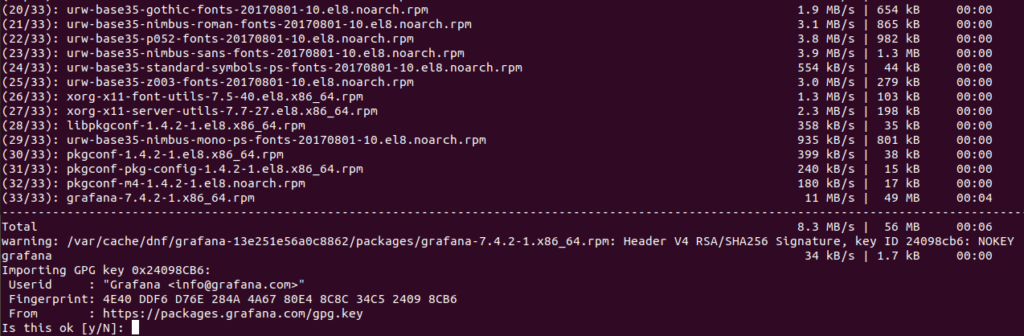
Import grafana GPG Key
Sucessfully installed grafana on centOS 8
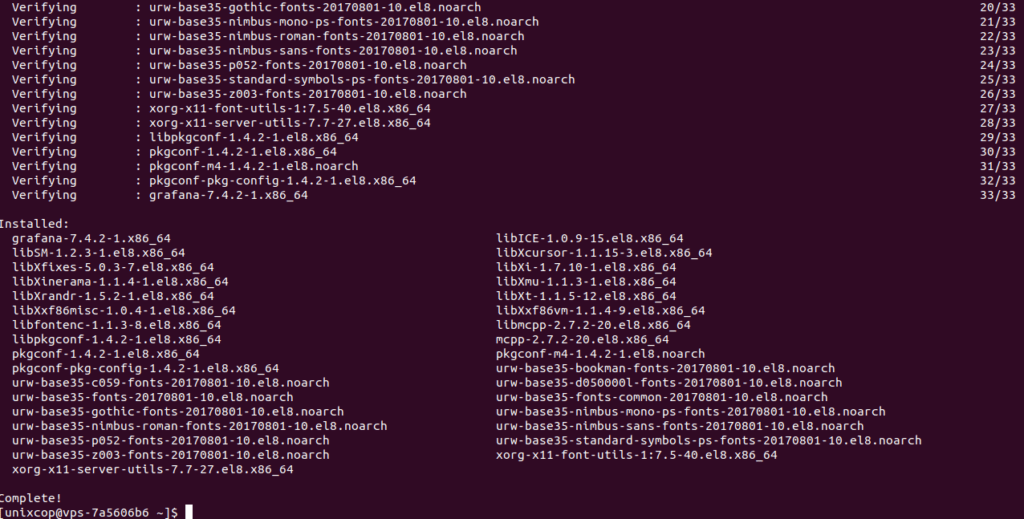
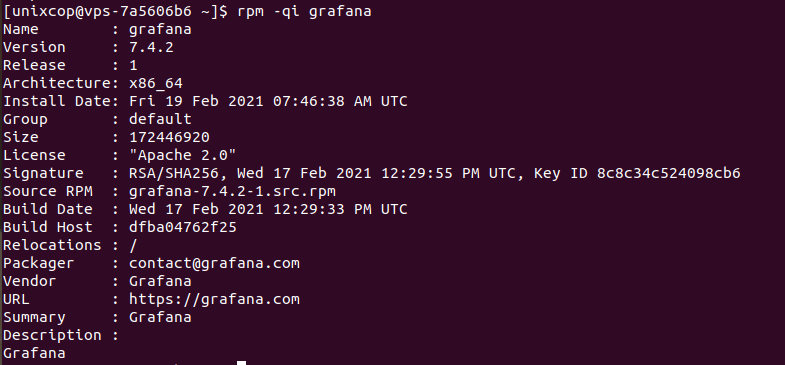
You can verify grafana package installed on your system and more details.
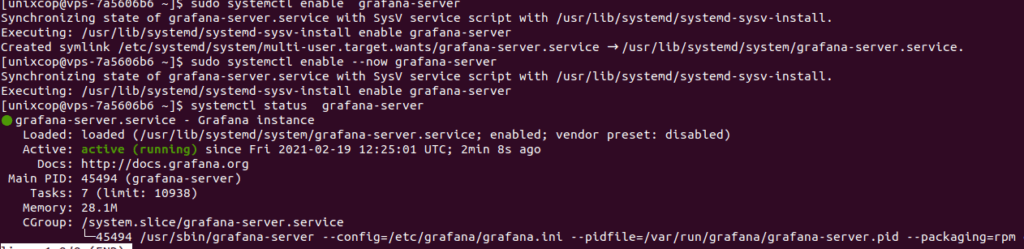
Enable Grafana service on centOS 8
sudo systemctl enable grafana-server
to check service is in running state use below command
> systemctl status grafana-server
If you are behind firewall please add below rule
port number 3000 is by default grafana port
> sudo firewall-cmd --add-port=3000/tcp --permanentReload firewall service.
firewall-cmd --reload
confirm port is allowed in firewall using below command
> firewall-cmd --list-all | grep 3000
once grafana server is started you can access grafana using below url
http://hostname:3000

user: admin, Password: admin
you can change password at first login

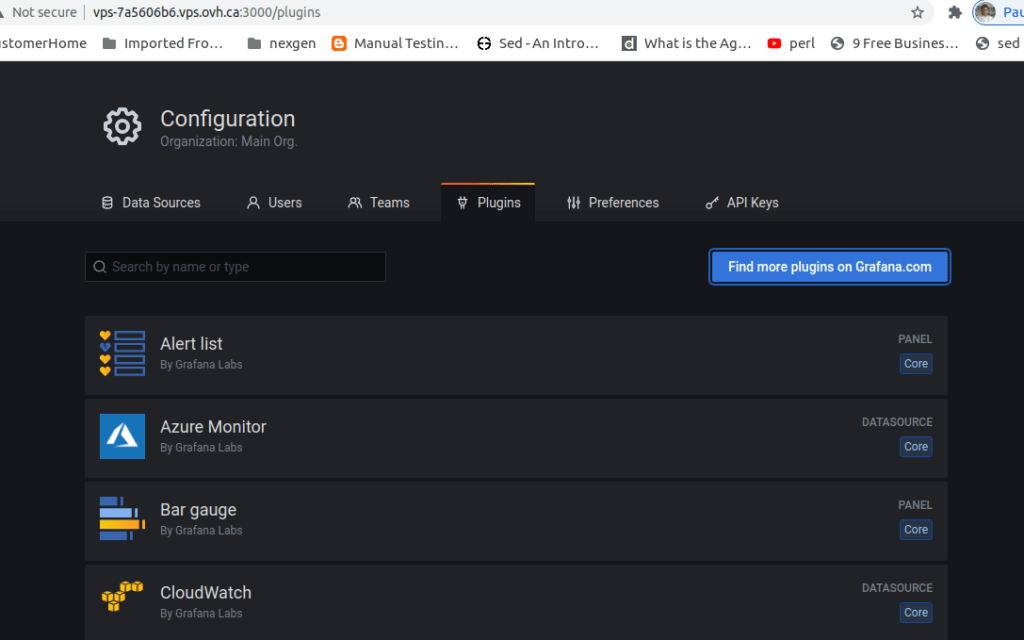
you can add different types of plugins as per your requirement from plugins section
go to setting > plugins
select plugin name
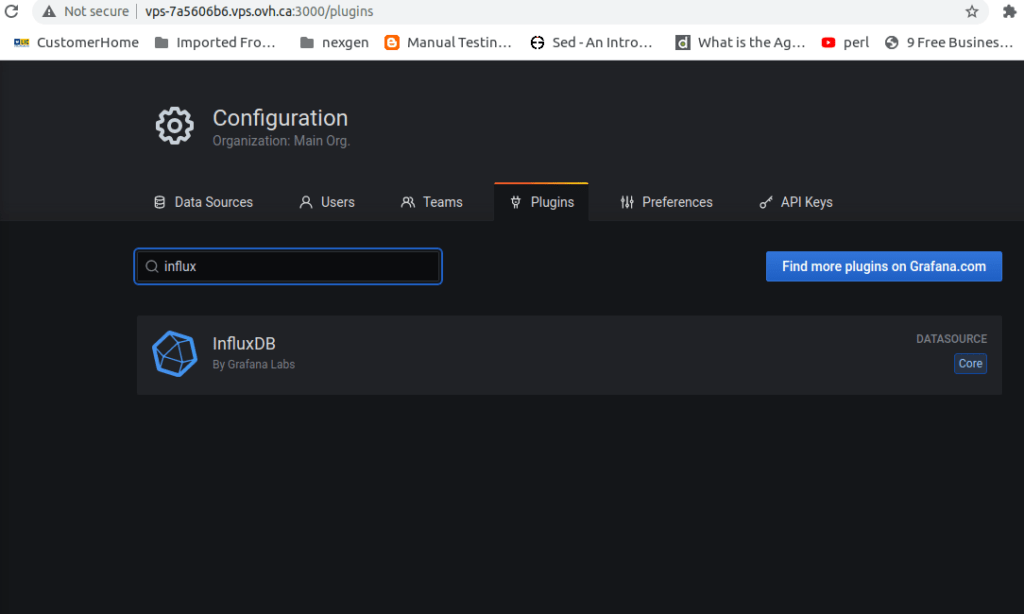
if plugins are not available in core grafana click on “find more plugins on Grafana.com”
it will redirect to https://grafana.com/grafana/plugins/grafana-clock-panel/installation
you can manually download the .zip file and unpack it into your grafana plugins directory.
Package details
- Installs binary to
/usr/sbin/grafana-server - Copies init.d script to
/etc/init.d/grafana-server - Installs default file (environment vars) to
/etc/sysconfig/grafana-server - Copies configuration file to
/etc/grafana/grafana.ini - Installs systemd service (if systemd is available) name
grafana-server.service - The default configuration uses a log file at
/var/log/grafana/grafana.log - The default configuration specifies an sqlite3 database at
/var/lib/grafana/grafana.db