Introduction
In this article we will discus the most common commands with examples which are used in process monitoring in Linux systems such as :
- ps
- top
- htop
- lsof
1. ps
As we all know Linux is a multitasking and multi-user systems. So, it allows multiple processes to operate simultaneously without interfering with each other. Process is one of the important fundamental concept of the Linux OS. A process is an executing instance of a program and carry out different tasks within the operating system.
Linux provides us a utility called ps for viewing information related with the processes on a system which stands as abbreviation for “Process Status”. ps command is used to list the currently running processes and their PIDs along with some other information depends on different options. It reads the process information from the virtual files in /proc file-system. /proc contains virtual files, this is the reason it’s referred as a virtual file system.
ps provides numerous options for manipulating the output according to our need.
Syntax :
ps [options]Options for ps Command :
1- Simple process selection :
Shows the processes for the current shell
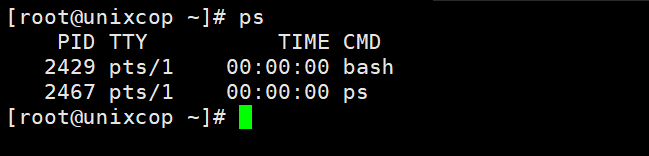
Result contains four columns of information.
Where,
PID – the unique process ID
TTY – terminal type that the user is logged into
TIME – amount of CPU in minutes and seconds that the process has been running
CMD – name of the command that launched the process.
Note – Sometimes when we execute ps command, it shows TIME as 00:00:00. It is nothing but the total accumulated CPU utilization time for any process and 00:00:00 indicates no CPU time has been given by the kernel till now. In above example we found that, for bash no CPU time has been given. This is because bash is just a parent process for different processes which needs bash for their execution and bash itself is not utilizing any CPU time till now.
2. View Processes :
View all the running processes use either of the following option with ps –
# ps -A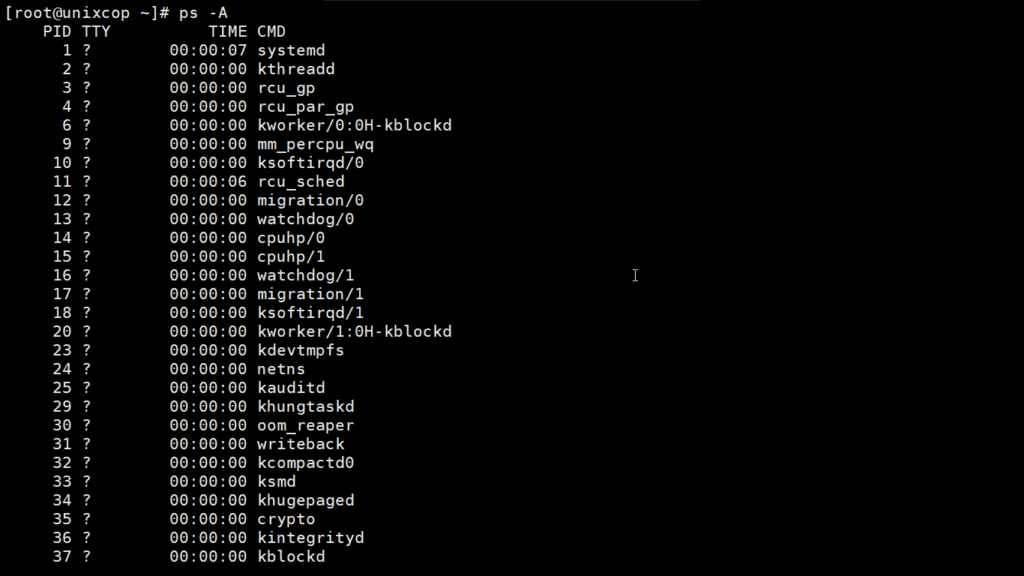
# ps -e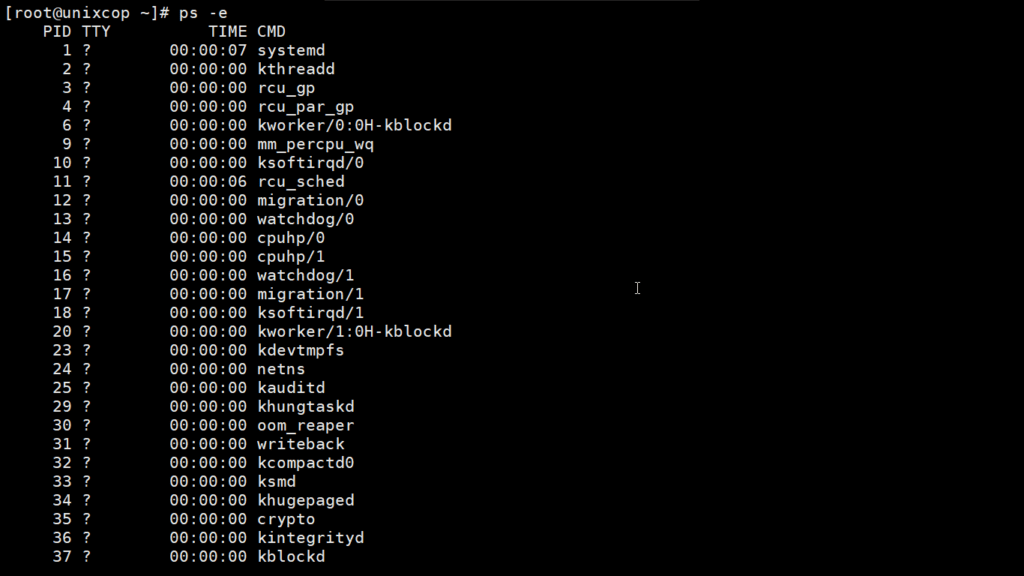
3. View Processes not associated with a terminal :
View all processes except both session leaders and processes not associated with a terminal.
# ps -a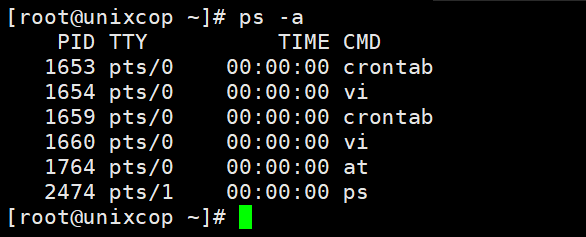
Note – You may be thinking that what is session leader? A unique session is assing to evry process group. So, session leader is a process which kicks off other processes. The process ID of first process of any session is similar as the session ID.
4. View all the processes except session leaders :
# ps -d5. View all processes except those that fulfill the specified conditions (negates the selection) :
Example – If you want to see only session leader and processes not associated with a terminal. Then, run
# ps -a -N
or
# ps -a --deselect
6. View all processes associated with this terminal :
# ps -T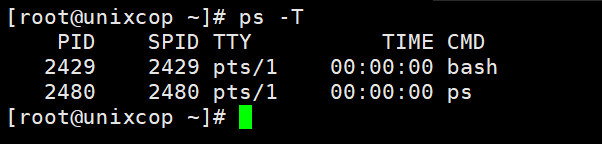
7. View all the running processes :
# ps -r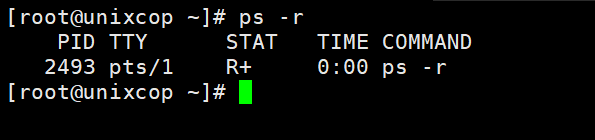
8. View all processes owned by you : Processes i.e same EUID as ps which means runner of the ps command, root in this case
# ps -xProcess selection by list
Here we will discuss how to get the specific processes list with the help of ps command. These options accept a single argument in the form of a blank-separated or comma-separated list. They can be used multiple times.
For example: ps -p “1 2” -p 3,4
- Select the process by the command name. This selects the processes whose executable name is given in cmdlist. There may be a chance you won’t know the process ID and with this command it is easier to search.
Syntax : ps -C command_name
Example:
[root@unixcop ~]# ps -C dhclient
PID TTY TIME CMD
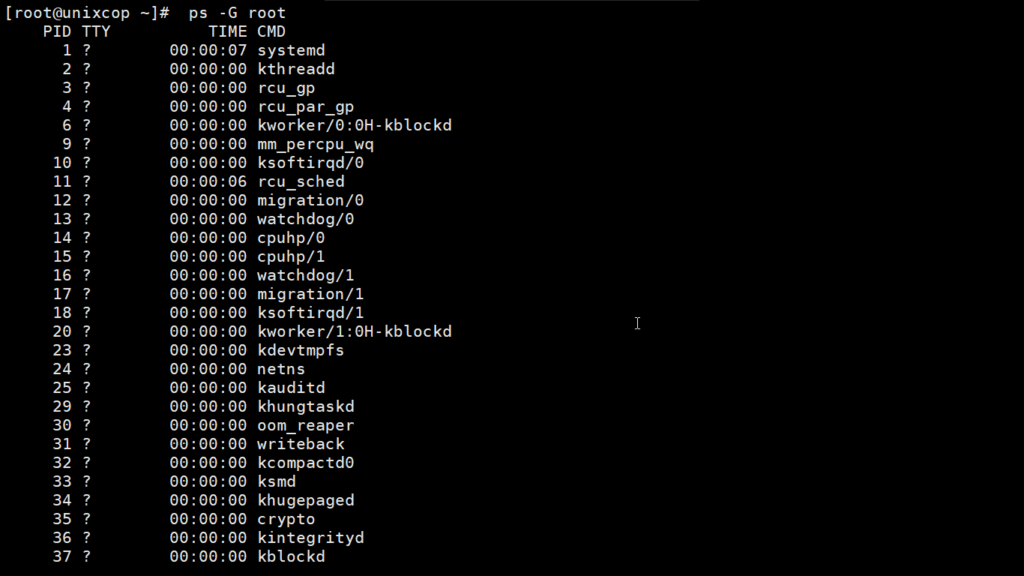
19815 ? 00:00:00 dhclient2. Select by group ID or name. The group ID identifies the group of the user who created the process.
Syntax : ps -G group_name
         ps --Group group_name

Example :
[root@unixcop ~]# ps -G root
3. View by group id :
Syntax : ps -g group_id
              ps -group group_id
Now Example:
# ps -g 1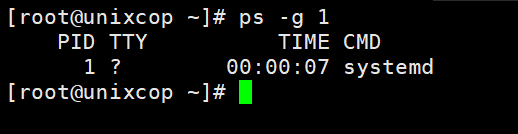
4. View process by process ID.
-Syntax :
ps p process_id
ps -p process_id
ps --pid process_id
And Examples:
[root@unixcop ~]#  ps p 27223
  PID TTY      STAT   TIME COMMAND
27223 ?        Ss     0:01 sshd: root@pts/2

[root@unixcop ~]#  ps -p 27223
  PID TTY          TIME CMD
27223 ?        00:00:01 sshd

[root@unixcop ~]#  ps --pid 27223
  PID TTY          TIME CMD
27223 ?        00:00:01 sshd
You can view multiple processes by specifying multiple process IDs separated by blank or comma –
–For Example :
[root@unixcop ~]#  ps -p 1 904 27223
  PID TTY      STAT   TIME COMMAND
    1 ?        Ss     0:13 /usr/lib/systemd/systemd --switched-root --system --d
  904 tty1     Ssl+   1:02 /usr/bin/X -core -noreset :0 -seat seat0 -auth /var/r
27223 ?        Ss     0:01 sshd: root@pts/2
Here, we mentioned three process IDs – 1, 904 and 27223 which are separated by blank.
5. Select by parent process ID. By using this command we can view all the processes owned by parent process except the parent process.
Examples:
[root@unixcop ~]# ps -p 766
  PID TTY          TIME CMD
  766 ?        00:00:06 NetworkManager

[root@unixcop ~]# ps --ppid 766
  PID TTY          TIME CMD
19815 ?        00:00:00 dhclient
In above example process ID 766 is assigned to NetworkManager and this is the parent process for dhclient with process ID 19815.
6. View all the processes belongs to any session ID.
Syntax :
ps -s session_id
ps --sid session_id

Example :
[root@unixcop ~]# ps -s 1248
  PID TTY          TIME CMD
 1248 ?        00:00:00 dbus-daemon
 1276 ?        00:00:00 dconf-service
 1302 ?        00:00:00 gvfsd
 1310 ?        00:00:00 gvfsd-fuse
 1369 ?        00:00:00 gvfs-udisks2-vo
 1400 ?        00:00:00 gvfsd-trash
 1418 ?        00:00:00 gvfs-mtp-volume
 1432 ?        00:00:00 gvfs-gphoto2-vo
 1437 ?        00:00:00 gvfs-afc-volume
 1447 ?        00:00:00 wnck-applet
 1453 ?        00:00:00 notification-ar
 1454 ?        00:00:02 clock-applet
7. Select by tty. This selects the processes associated with the mentioned tty :
The Syntax :
ps t tty
ps -t tty
ps --tty tty
For Example:
# ps -t pts/0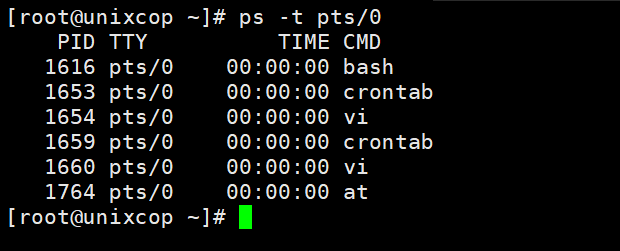
8. Select by effective user ID or name.
And the Syntax is :
ps U user_name/ID
ps -U user_name/ID
Output Format control
These options are used to choose the information displayed by ps. There are multiple options to control output format. These option can be combined with any other options like e, u, p, G, g etc, depends on our need.
1. Use -f to view full-format listing.
ps -af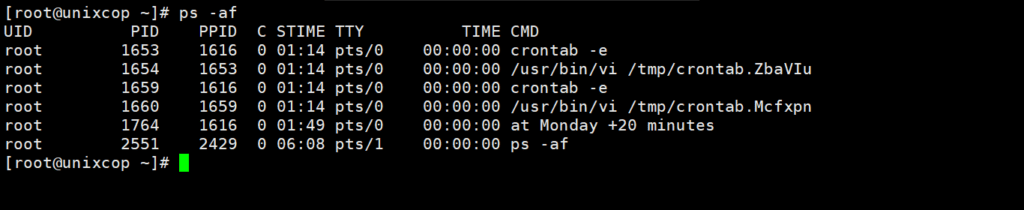
2. Use -F to view Extra full format.
ps -F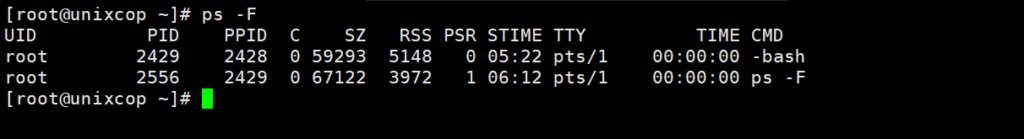
3. To view process according to user-defined format.
#  ps --formate column_name
#  ps -o column_name
# ps o column_nameExample:
ps -aN --format cmd,pid,user,ppid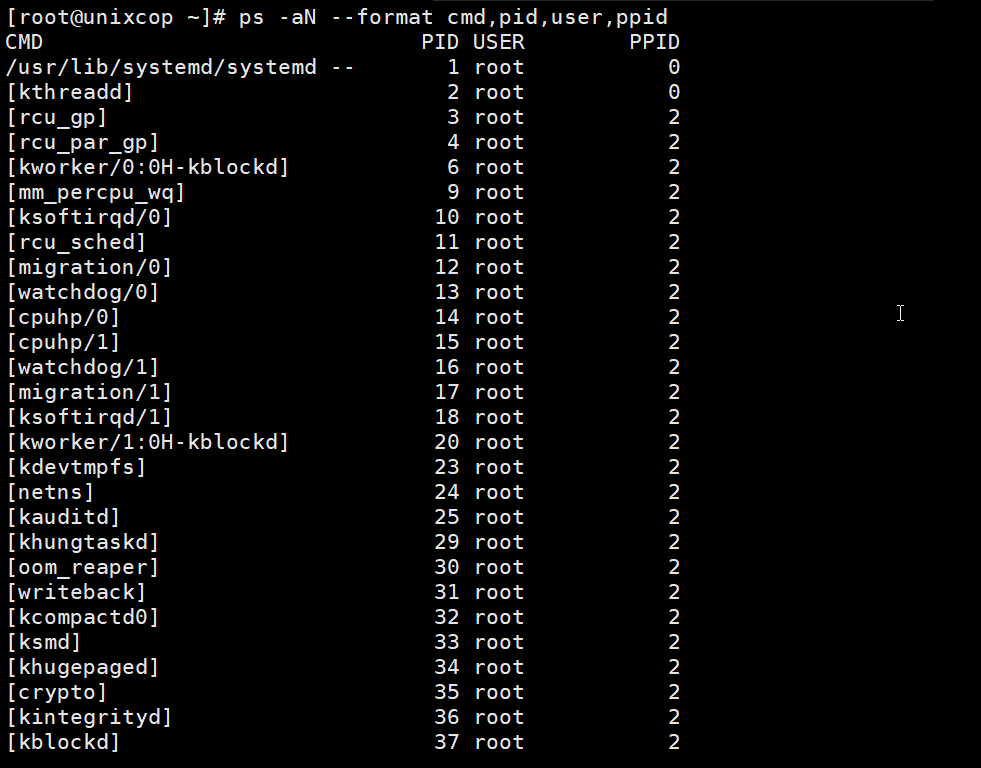
In this example I wish to see command, process ID, username and parent process ID, so I pass the arguments cmd, pid, user and ppid respectively.
4. View in BSD job control format :
ps -j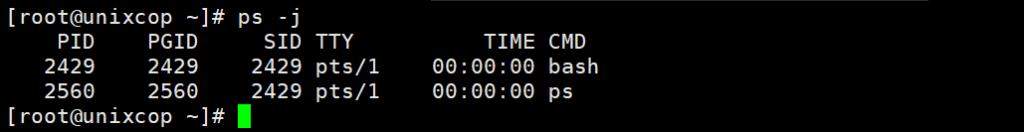
5. Display BSD long format :
ps l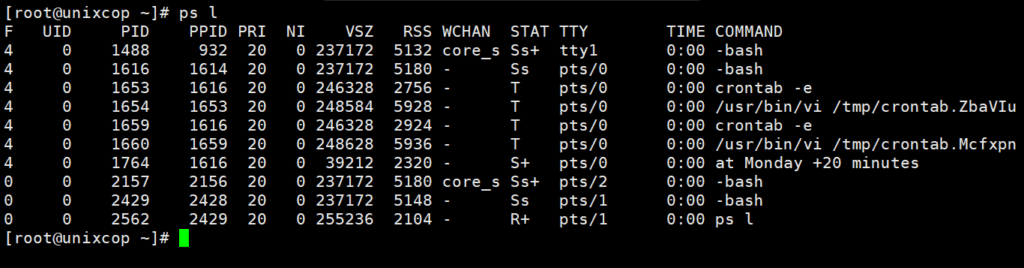
6. Add a column of security data.
ps -aM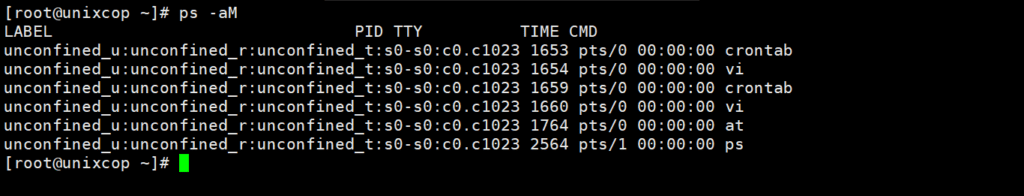
7. View command with signal format.
[root@unixcop ~]# ps s 766
8. Display user-oriented format
ps u 1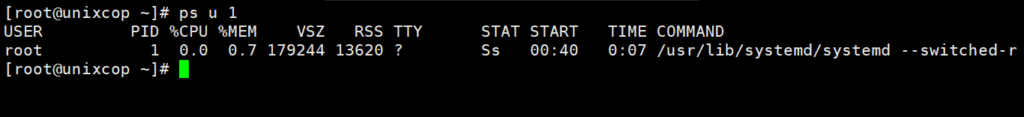
9. Display virtual memory format
ps v 1
10. If you want to see environment of any command. Then use option **e** –
[root@unixcop ~]# ps ev 766
  PID TTY      STAT   TIME  MAJFL   TRS   DRS   RSS %MEM COMMAND
  766 ?        Ssl    0:08     47  2441 545694 10448  1.0 /usr/sbin/NetworkManager --no-daemon LANG=en_US.UTF-8 PATH=/usr/local/sbin:/usr/local/bin:/usr/sbin:/usr/bin
11. View processes using highest memory.
ps -eo pid,ppid,cmd,%mem,%cpu --sort=-%mem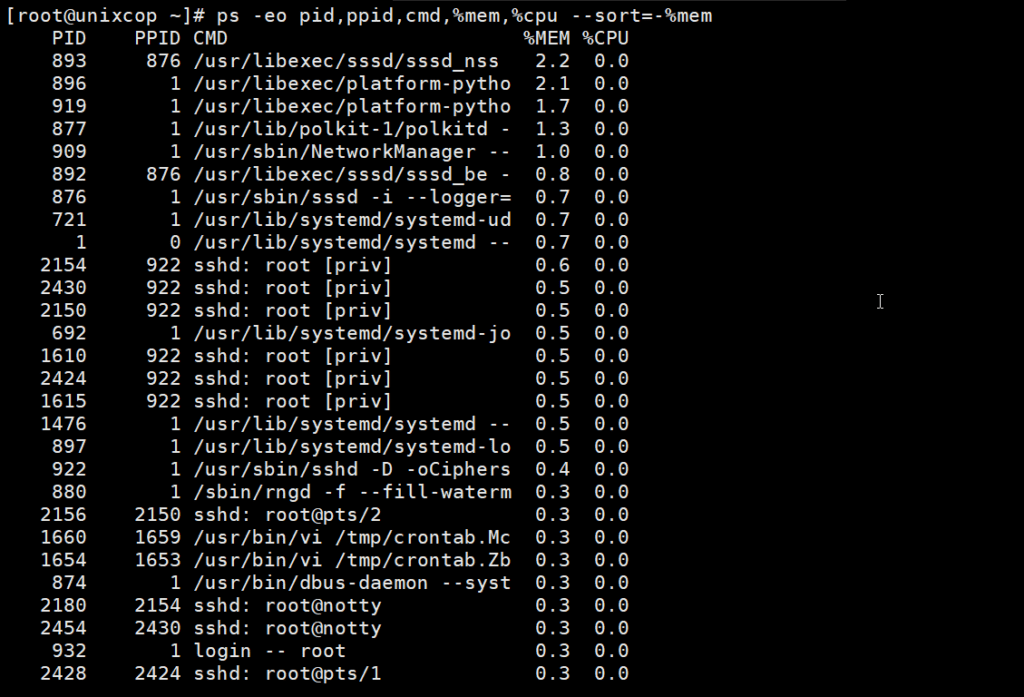
12. print a process tree
[root@unixcop ~]# ps --forest -C sshd
  PID TTY          TIME CMD
  797 ?        00:00:00 sshd
11680 ?        00:00:03  \_ sshd
16361 ?        00:00:02  \_ sshd
13. List all threads for a particular process. Use either the -T or -L option to display threads of a process.
[root@unixcop ~]# ps -C sshd -L
  PID   LWP TTY          TIME CMD
  797   797 ?        00:00:00 sshd
11680 11680 ?        00:00:03 sshd
16361 16361 ?        00:00:02 sshd
Note – For the explanation of different column contents refer man page.
Reference : Man page
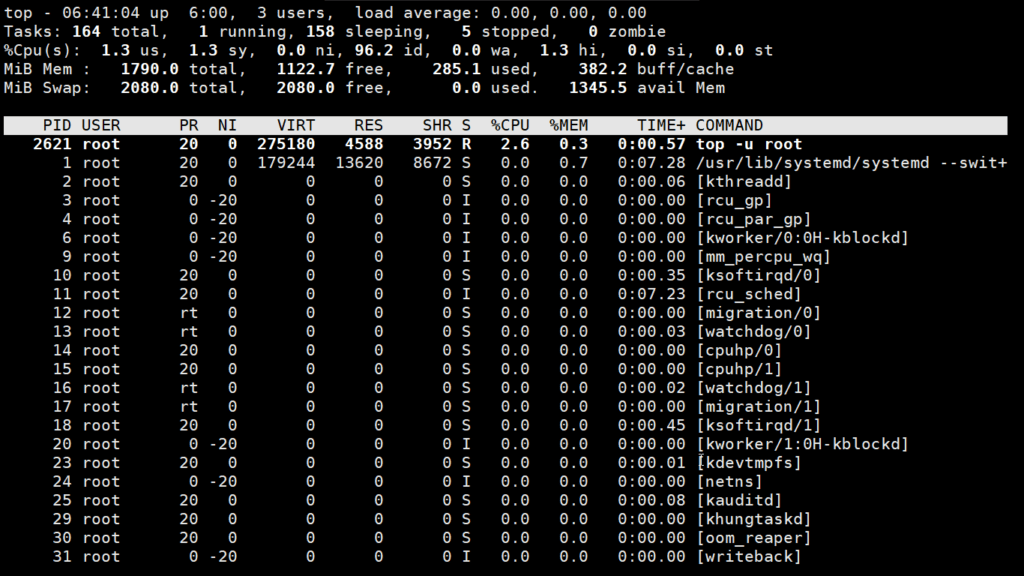
2. top
top command is used to show the Linux processes. It provides a dynamic real-time view of the running system. Usually, this command shows the summary information of the system and the list of processes or threads which are currently managed by the Linux Kernel.
As soon as you will run this command it will open an interactive command mode where the top half portion will contain the statistics of processes and resource usage. And Lower half contains a list of the currently running processes. Pressing q will simply exit the command mode.
Syntax:
top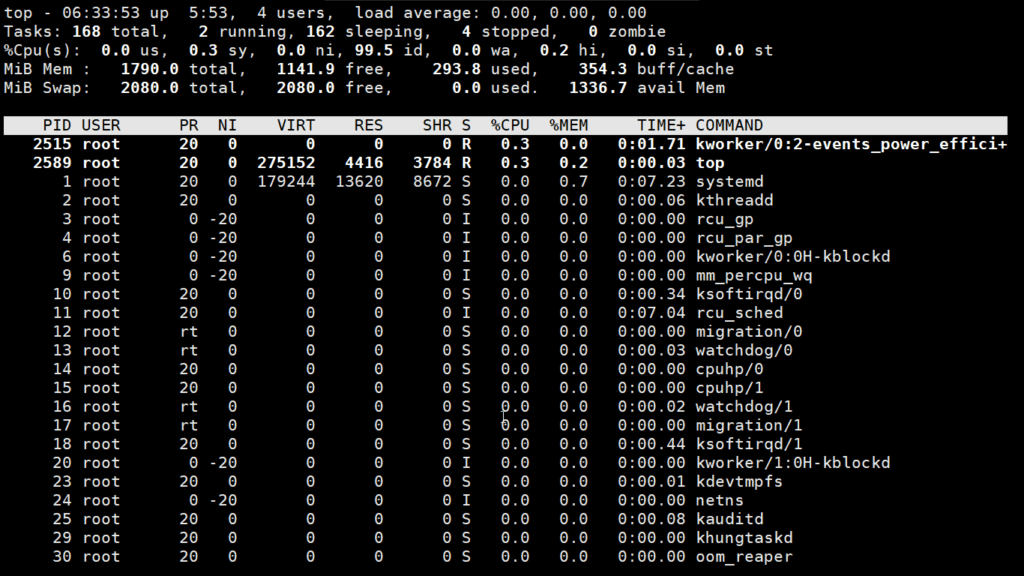
Here,
- PID: Shows task’s unique process id.
- PR: Stands for priority of the task.
- SHR: Represents the amount of shared memory used by a task.
- VIRT: Total virtual memory used by the task.
- USER: User name of owner of task.
- %CPU: Represents the CPU usage.
- TIME+: CPU Time, the same as ‘TIME’, but reflecting more granularity through hundredths of a second.
- SHR: Represents the Shared Memory size (kb) used by a task.
- NI: Represents a Nice Value of task. A Negative nice value implies higher priority, and positive Nice value means lower priority.
- %MEM: Shows the Memory usage of task.
Examples:
1) Exit Top Command After Specific repetition: Top output keep refreshing until you press ‘q‘. With below command top command will automatically exit after 20 number of repetition.
top -n 102) Display Specific User Process
top -u unixcophere the user called unixcop
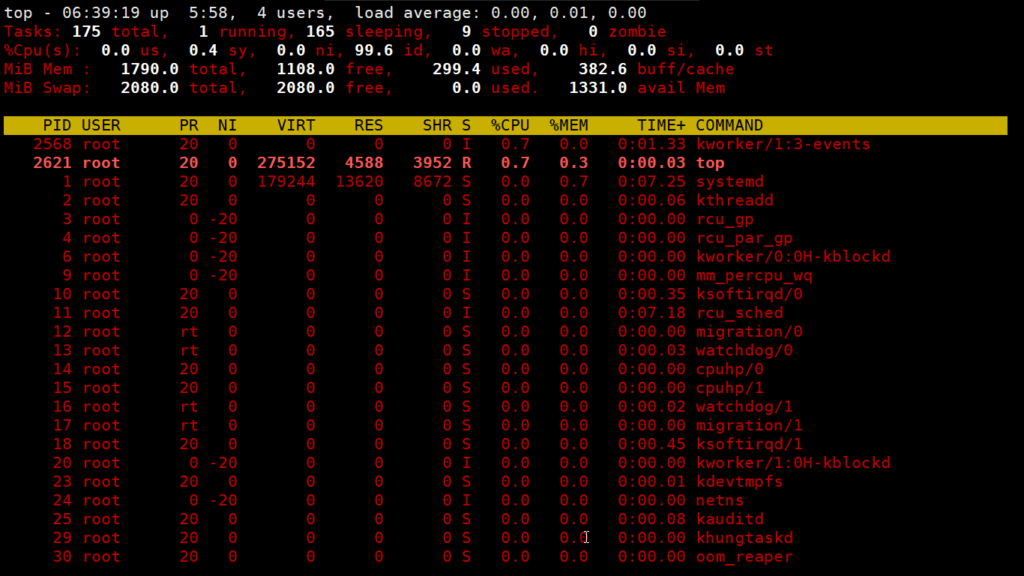
3) Highlight Running Process in Top: Press ‘z‘ option in running top command will display running process in color which may help you to identified running process easily
4) Shows Absolute Path of Processes:
Press ‘c‘ option in running top command, it will display absolute path of running pro
5) Kill running process: You can kill a process after finding PID of process by pressing ‘k‘ option in running top command without exiting from top window as shown below.
6) Sort by CPU Utilisation: Press (Shift+P) to sort processes as per CPU utilization.
7) Shows top command syntax:
top -h 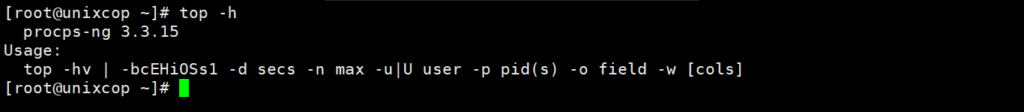
8) Batch Mode : Send output from top to file or any other programs.
top -b
9) Secure Mode : Use top in Secure mode.
top -s10) Command Line : The below command starts top with last closed state.
Top -c11) Delay time : It tells delay time between screen updates.
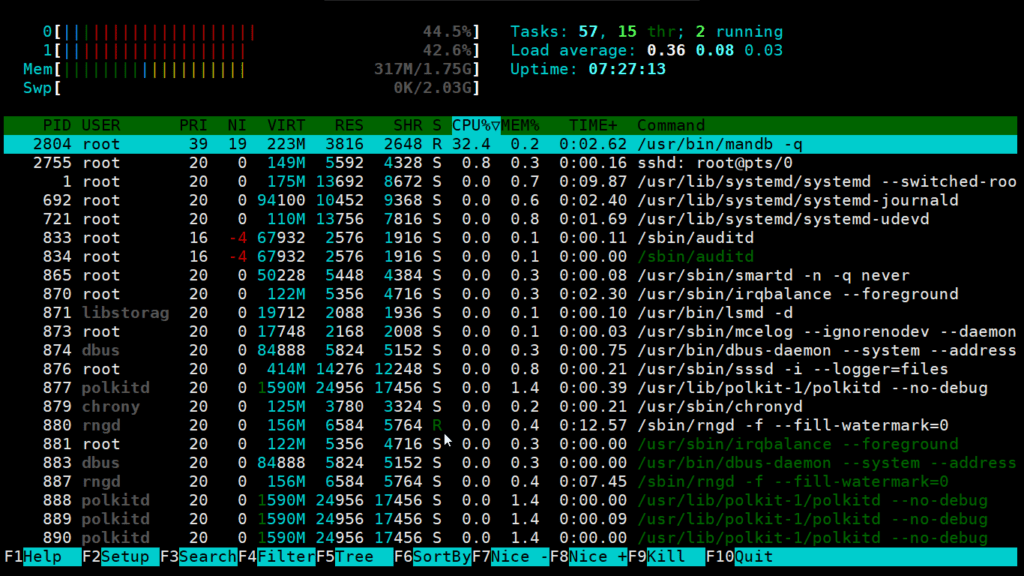
top -d seconds.tenths3. htop
htop command in Linux system is a command line utility that allows the user to interactively monitor the system’s vital resources or server’s processes in real time. htop is a newer program compared to top command, and it offers many improvements over top command. htop supports mouse operation, uses color in its output and gives visual indications about processor, memory and swap usage. htop also prints full command lines for processes and allows one to scroll both vertically and horizontally for processes and command lines respectively.
Syntax:
htop [-dChusv]Example:
Options:
- -d –delay : Used to show the delay between updates, in tenths of seconds.
- -C –no-color –no-colour : Start htop in monochrome mode.
- -h –help : Used to display the help message and exit.
- -u –user=USERNAME : Used to show only the processes of a given user.
htop -u qadry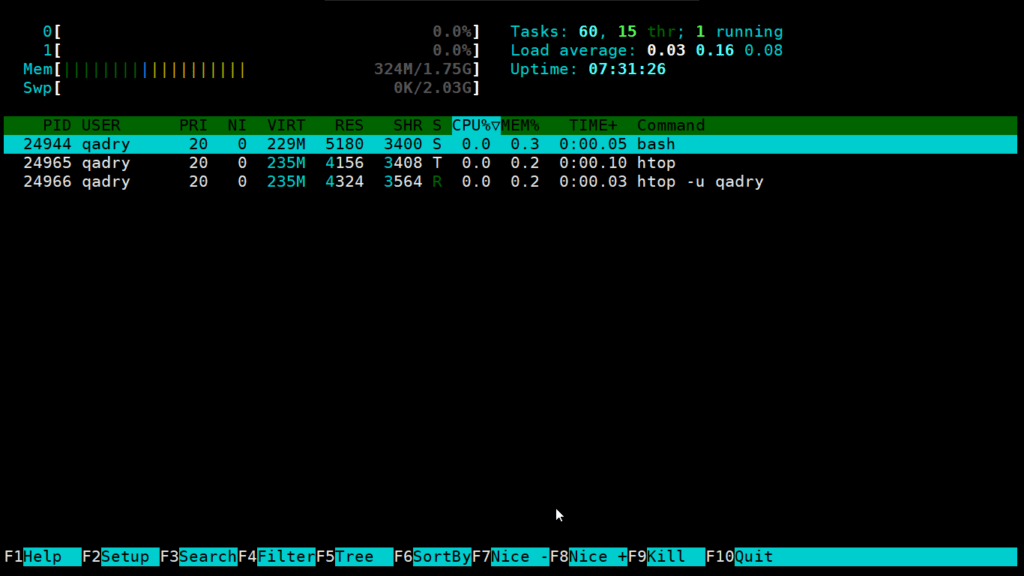
- -p –pid=PID, PID… : Used to show only the given PIDs.
- -s –sort-key COLUMN : Sort by this column (use –sort-key help for a column list).
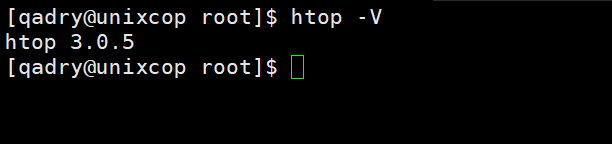
- -V –version : Output version information and exit.
Interactive Commands:

- Arrows, Page Up, Page Down, Home, End: Scroll the process list.
- Space: Tag or untag a process.
- U – Untag all processes (remove all tags added with the Space key).
- s – Trace process system calls.
- F1 – Help
- F2 – setup
- F3 – search
- F4 – filtering: type in part of a process command line and only processes whose names match will be shown.
- F5 – Tree view.
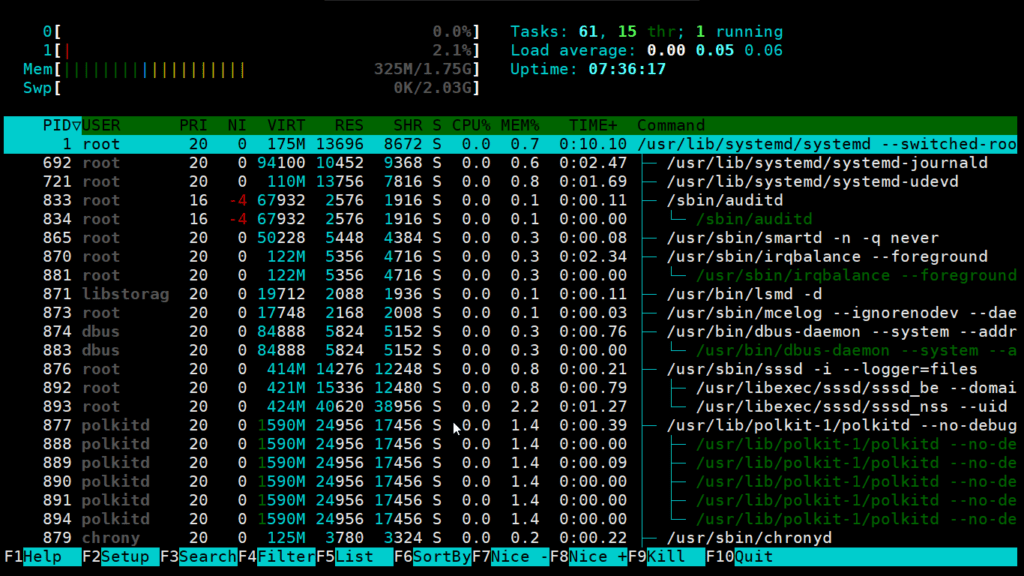
- F6 – Sorting.
- F7 – Increase the selected process’s priority. This can only be done by the superuser.
- F8 – Decrease the selected process’s priority.
- F9 – Kill process.
- F10 – Quit.
4. lsof
Linux/Unix consider everything as file and maintains folder. So “Files or a File ” is very important in Linux/Unix. While working in Linux/Unix system there might be several file and folder which are being used, some of them would be visible and some not.
lsof command stands for List Of Open File. This command provides a list of files that are opened. Basically, it gives the information to find out the files which are opened by which process. With one go it lists out all open files in output console. It cannot only list common regular files but it can list a directory, a block special file, a shared library, a character special file, a regular pipe, a named pipe, an internet socket, a UNIX domain socket, and many others. it can be combined with grep command can be used to do advanced searching and listing.
Syntax:
lsof [option][user name]Options with Examples:
- List all open files: This command lists out all the files that are opened by any process in the system.
lsof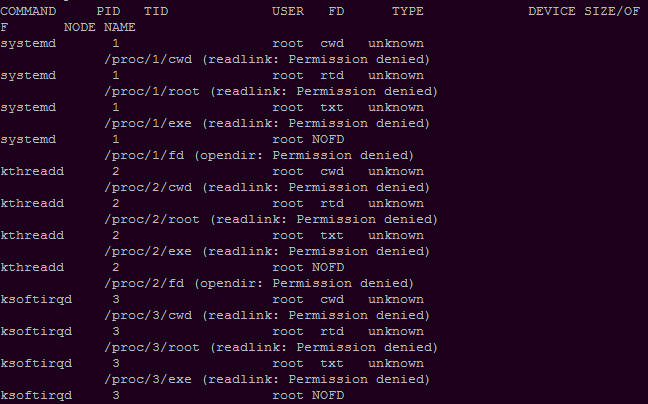
Here, you observe there are details of files which are opened. Process Id, the user associated with the process, FD(file descriptor), size of the file all together gives detailed information about the file opened by the command, process ID, user, its size etc.
- FD represents as File descripter.
- cwd : Current working directory.
- txt : Text file.
- mem : Memory file.
- mmap : Memory mapped device.
- List all files opened by a user: There are several users of a system and each user have different requirements and accordingly they use files and devices. To find a list of files that are opened by a specific user this command is useful.
Syntax:
lsof -u usernameExample:
lsof -u qadry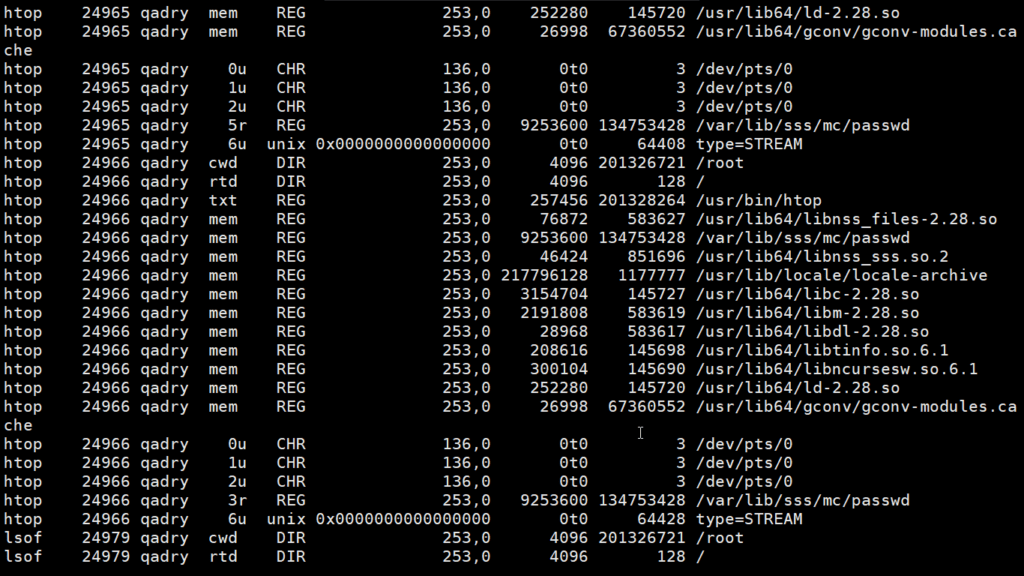
In the figure given above with the command lsof -u qadry lists out all the files opened by user. Along with that we can see the type of file here and they are:
- DIR: Directory
- REG: Regular file
- CHR: Character special file
- List all files which are opened by everyone except a specific user: With the help of this command you can list out all the files opened by all the process and all the user. But when we want to find the list of files that are opened by all users except a particular user then we can use:
Syntax:
lsof -u ^root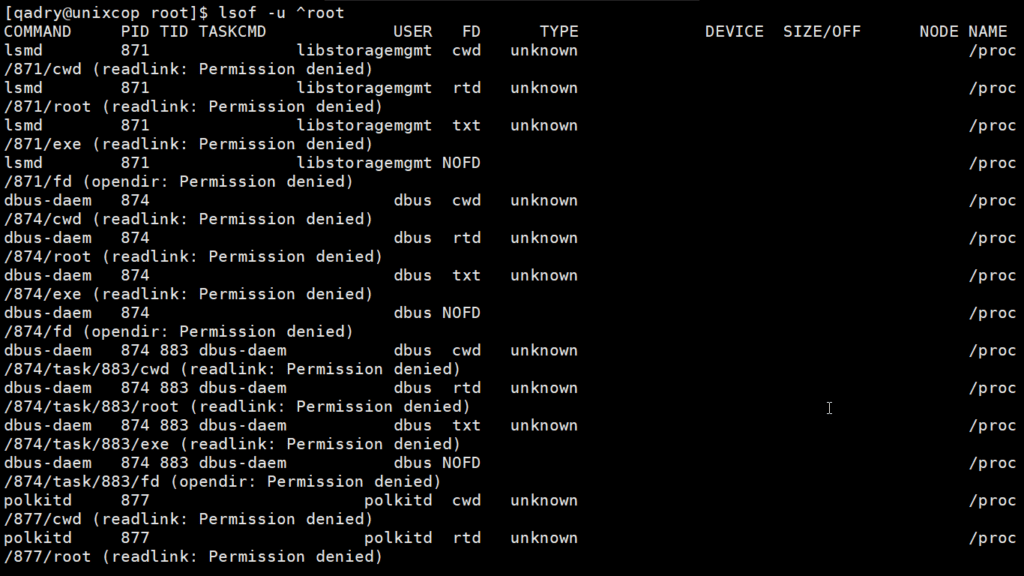
In the given figure we can observe there are no files that are opened by the root user.
- List all open files by a particular Process: This command can list out all the files opened by a particular process. -c followed by process names can find out all the files that are opened by that particular process that is named in the command.
Syntax:
lsof -c crond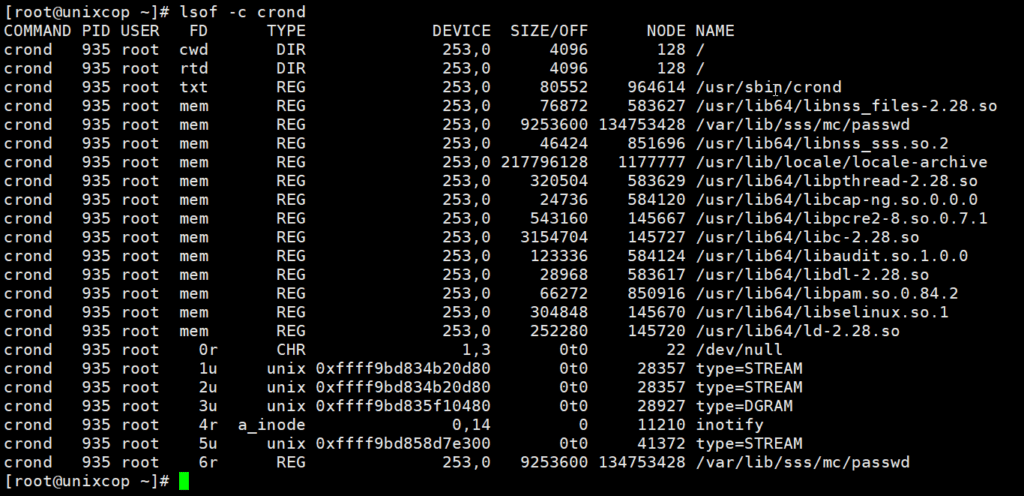
Here, you can observe that the files and their description opened by crond process.
- List all open files that are opened by a particular process: Each file is associated with some process ID. There can be many files that are opened by a particular process. By using lsof -p process ID, files opened by a particular process can be checked.
Syntax:
lsof -p process IDExample:
lsof -p 2781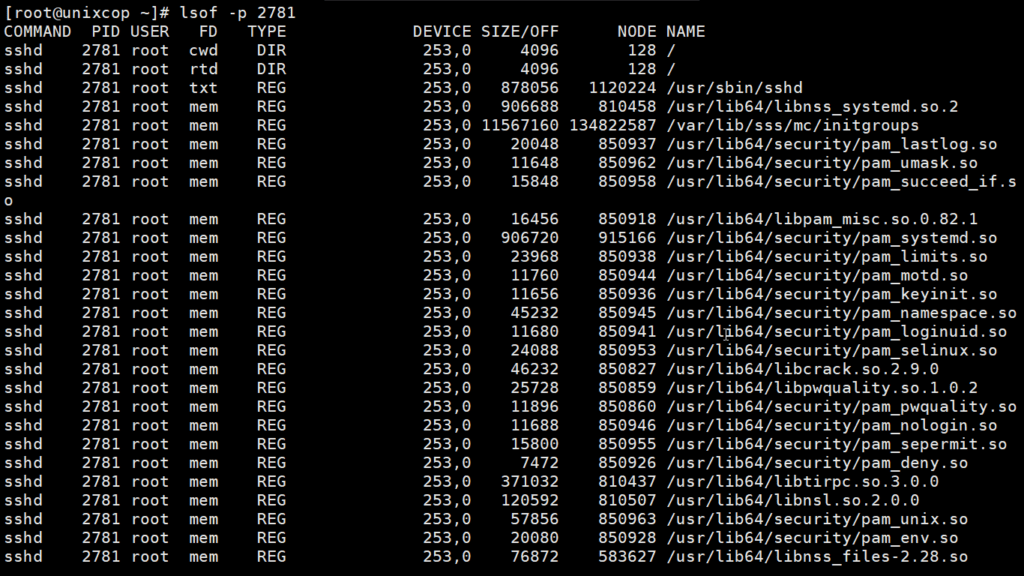
- Files opened by all other PID: As the above-given figure command lists out the files opened by a particular process ID. In the same way, you can use below command option to find out the list of files which are not opened by a particular process ID.
Syntax:
lsof -p ^process ID- List parent process IDs: There is a large number of process running in a system and they have files opened for its usage. There may be many child processes of a process and this process can also be termed as the parent process. To find out the list of files opened by parent process Id lsof command is used with the option -R.
Syntax:
lsof -R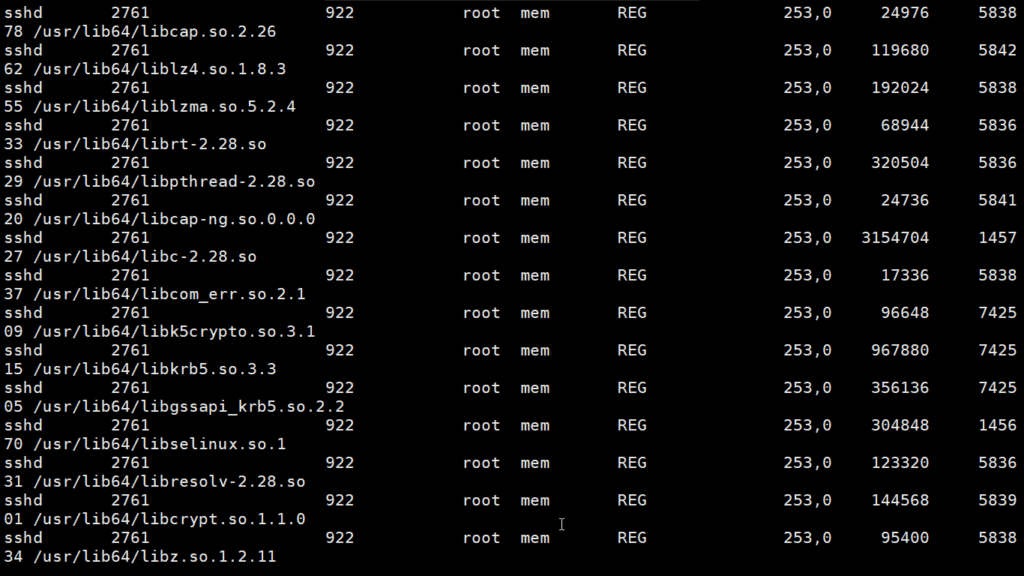
- Files opened by a directory: It lists out the files which are opened by a particular directory. There are files as well as the directory in a system. So there can be several files opened by a directory as well as the regular file.
Syntax:
lsof -D directory path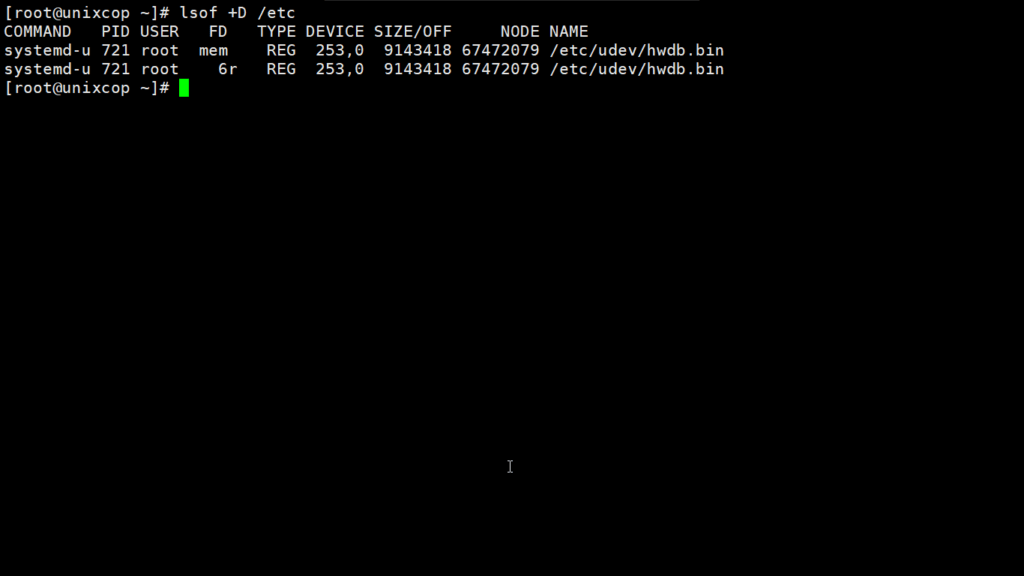
- Files opened by network connections: Our Pc/system can be connected through various networks which helps in a variety of purpose. As we know that in Linux everything is a file, so we can even check the files that are opened by some network connections in the system.
Syntax:
lsof -i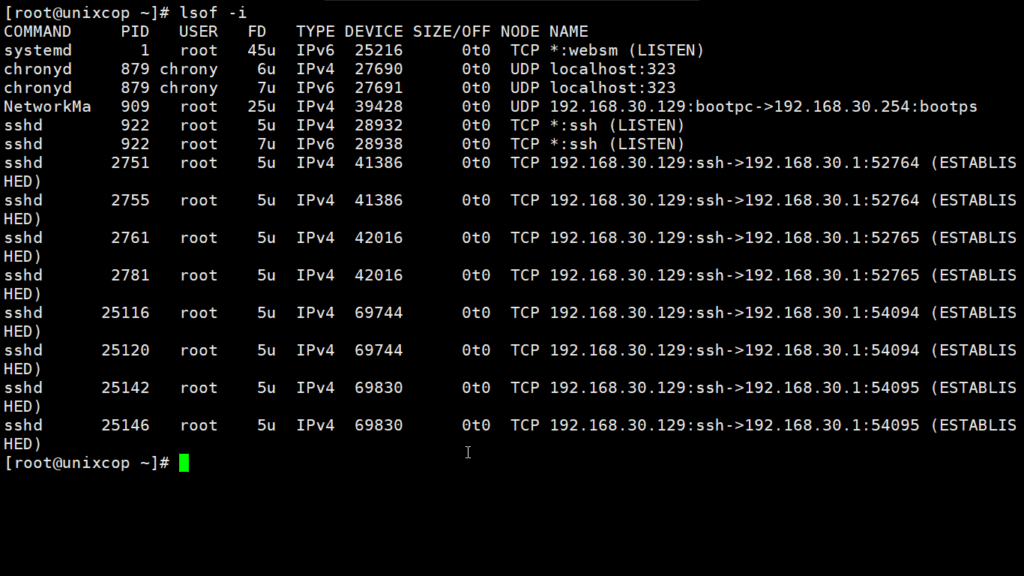
Example:
lsof -i tcp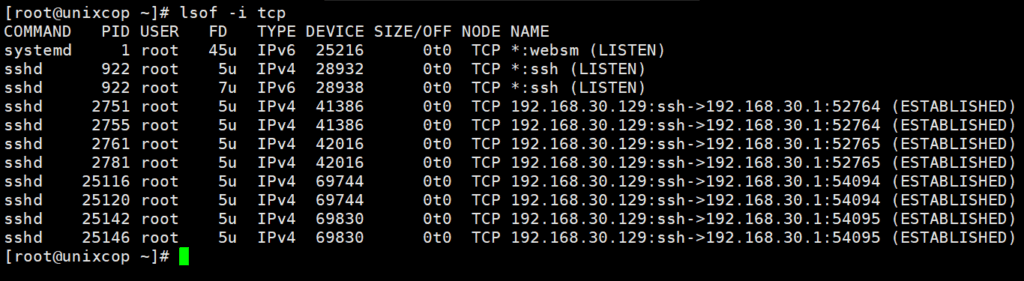
Here in the figure, we can see the files opened by the TCP network. In the same way, we can check for UDP etc.
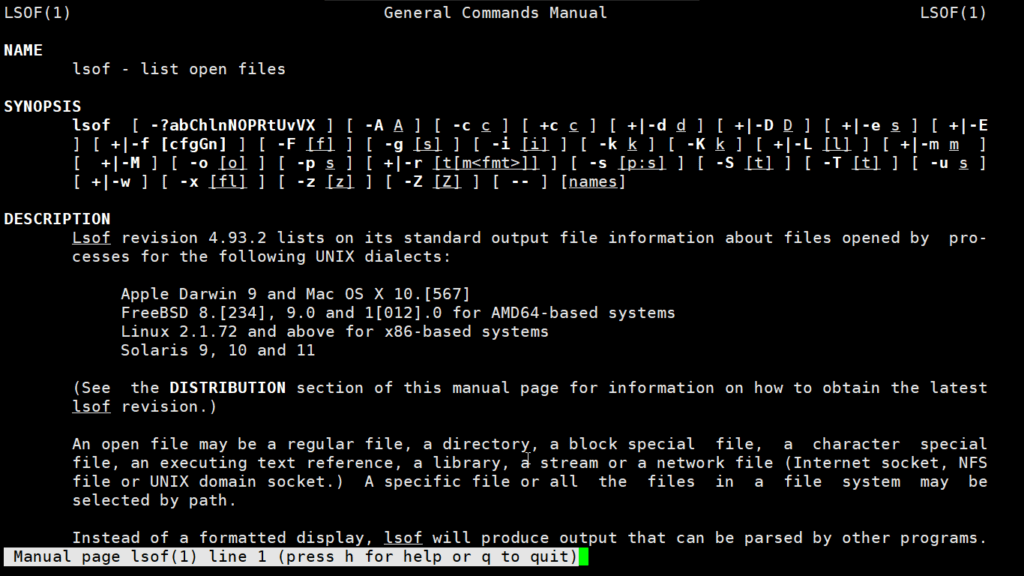
Note: To know more in details about the lsof command you can see the manual page as follows:
man lsof