OSSEC is an open source host-based intrusion detection system that can be used to keep track of servers activity. It supports most operating systems such as Linux, FreeBSD, OpenBSD, Windows, Solaris and much more. It is used to monitor one server or multiple servers in server/agent mode and give you a real-time view into what’s happening on your server. OSSEC has a cross-platform architecture that enables you to monitor multiple systems from centralized location.
In this tutorial, we will learn how to install and configure OSSEC to monitor local Ubuntu 20.04 server. We will also install OSSEC Web UI and test OSSEC against any file modification
Install Required Dependencies
First, you will need to update your system with the latest stable version. You can do this with the following command:
apt-get update -y
apt-get upgrade -y
Install OSSEC
First, download the latest version of the OSSEC from GitHub repository with the following command:
wget https://github.com/ossec/ossec-hids/archive/2.9.0.tar.gzOnce the download is completed, extract the downloaded file with the following command:
tar -xvzf 2.9.0.tar.gzNext, change the directory to the extracted directory, then run install.sh to install OSSEC:
cd ossec-hids-2.9.0
sh install.sh
You will be prompted to answer some questions:
Select your language, if your language is English then type en and press Enter:
(en/br/cn/de/el/es/fr/hu/it/jp/nl/pl/ru/sr/tr) [en]:enYou should see the following output:
OSSEC HIDS v2.9.0 Installation Script - http://www.ossec.net

You are about to start the installation process of the OSSEC HIDS.
You must have a C compiler pre-installed in your system.

- System: Linux Node1 4.4.0-45-generic
- User: root
- Host: localhost

 -- Press ENTER to continue or Ctrl-C to abort. --
Press Enter, you should see the following output:
- What kind of installation do you want (server, agent, local, hybrid or help)? ServerChoose local to monitor the server it has been installed on then press Enter:
- Server installation chosen.

2- Setting up the installation environment.

- Choose where to install the OSSEC HIDS [/var/ossec]:
Choose OSSEC install location and press Enter:
- Installation will be made at /var/ossec .

3- Configuring the OSSEC HIDS.

3.1- Do you want e-mail notification? (y/n) [y]: y
Type y and press Enter if you want to get e-mail notification:
- What's your e-mail address? root@localhost

- We found your SMTP server as: 127.0.0.1
- Do you want to use it? (y/n) [y]: y
Type your local e-mail address and press Enter:
3.2- Do you want to run the integrity check daemon? (y/n) [y]:
    - Running syscheck (integrity check daemon).
Press Enter for integrity check daemon:
3.3- Do you want to run the rootkit detection engine? (y/n) [y]:
    - Running rootcheck (rootkit detection).
Also Press Enter for rootkit detection engine:
- Do you want to enable active response? (y/n) [y]:
    - Active response enabled.
Then Press Enter to enable active response:
- Do you want to enable the firewall-drop response? (y/n) [y]:
    - firewall-drop enabled (local) for levels >= 6
And Press Enter to enable the firewall-drop response:
- Default white list for the active response:
    - 192.168.15.1

- Do you want to add more IPs to the white list? (y/n)? [n]: n
Type n and press Enter if you don’t want to add white list:
3.5- Do you want to enable remote syslog (port 514 udp)? (y/n) [y]:
    - Remote syslog enabled.
Press Enter to enable remote Syslog:
- If you want to monitor any other file, just change the
ossec.conf and add a new localfile entry.
Any questions about the configuration can be answered
by visiting us online at http://www.ossec.net .

--- Press ENTER to continue ---
Note
if you got the following error message: run this command to resolve “sudo apt-get install build-essential”
sh: make: not foundFinally, Press Enter to start installation. Once the installation succeeds, you should see the following output:
- System is Debian (Ubuntu or derivative).
- Init script modified to start OSSEC HIDS during boot.

- Configuration finished properly.
- To start OSSEC HIDS:
 /var/ossec/bin/ossec-control start

- To stop OSSEC HIDS:
 /var/ossec/bin/ossec-control stop

- The configuration can be viewed or modified at /var/ossec/etc/ossec.conf

Thanks for using the OSSEC HIDS.
If you have any question, suggestion or if you find any bug,
contact us at [email protected] or using our public maillist at
[email protected]
( http://www.ossec.net/main/support/ ).

More information can be found at http://www.ossec.net

--- Press ENTER to finish (maybe more information below). ---
- In order to connect agent and server, you need to add each agent to the server.
Run the 'manage_agents' to add or remove them:

/var/ossec/bin/manage_agents
Edit /var/ossec/etc/ossec.conf to add
<syslog_output>
                <server>127.0.0.1</server>
                <port>5001</port>
                <format>default</format>
</syslog_output>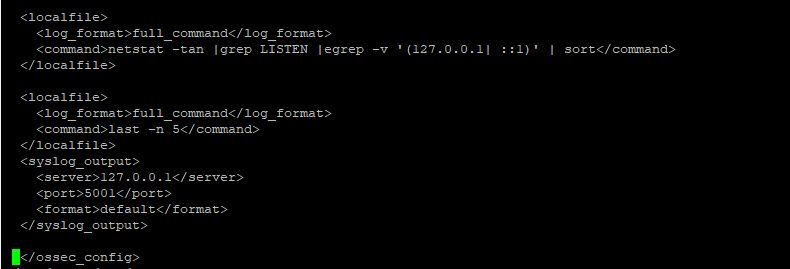
Once the installation completed, start OSSEC with the following command:
/var/ossec/bin/ossec-control enable client-syslog
/var/ossec/bin/ossec-control start
You should see the following output:
Starting OSSEC HIDS v2.9 (by Trend Micro Inc.)...
Started ossec-maild...
Started ossec-execd...
Started ossec-analysisd...
Started ossec-logcollector...
Started ossec-syscheckd...
Started ossec-monitord...
Completed.
Now, OSSEC is working fine
Install and Configure Elasticsearch
Install required packages.
sudo apt install apt-transport-https -y

wget -qO - https://artifacts.elastic.co/GPG-KEY-elasticsearch | sudo apt-key add -

echo "deb https://artifacts.elastic.co/packages/7.x/apt stable main" | sudo tee –a /etc/apt/sources.list.d/elastic-7.x.list

sudo apt update
And Install Elasticsearch,Logstash,Filebeat,Kibana
sudo apt install elasticsearch -y
sudo apt install logstash -y
sudo apt install Kibana -y
sudo apt install filebeat -y
Edit Elasticsearch configuration file.
sudo nano /etc/elasticsearch/elasticsearch.yml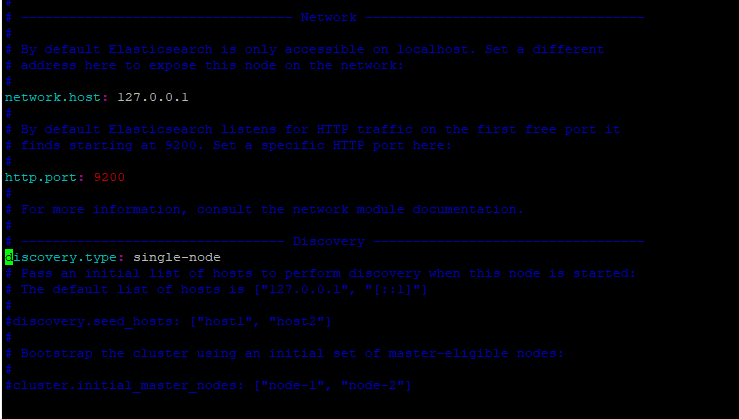
Start the Elasticsearch service.
 sudo systemctl daemon-reload
sudo systemctl start elasticsearch
sudo systemctl enable elasticsearch
Start the Logstash service.
sudo systemctl start logstash
sudo systemctl enable logstash
 sudo systemctl status logstash
Add file in logstash directory: /etc/logstash/conf.d/OSSEC-logstash.conf with following content:
input {
# stdin{}
  udp {
     port => 5001
     type => "ossec"
  }
}

filter {
  if [type] == "ossec" {
    grok {
      match => { "message" => "%{SYSLOGTIMESTAMP:syslog_timestamp} %{SYSLOGHOST:syslog_host} %{DATA:syslog_program}: Alert Level: %{NONNEGINT:Alert_Level}; Rule: %{NONNEGINT:Rule} - %{DATA:Description}; Location: %{DATA:Location}; (user: %{USER:User};%{SPACE})?(srcip: %{IP:Src_IP};%{SPACE})?(user: %{USER:User};%{SPACE})?(dstip: %{IP:Dst_IP};%{SPACE})?(src_port: %{NONNEGINT:Src_Port};%{SPACE})?(dst_port: %{NONNEGINT:Dst_Port};%{SPACE})?%{GREEDYDATA:Details}" }
      add_field => [ "ossec_server", "%{host}" ]
    }
    mutate {
      remove_field => [ "message","syslog_timestamp", "syslog_program", "syslog_host", "syslog_message", "syslog_pid", "@version", "type", "host" ]
    }
  }
}

output {
  elasticsearch { hosts => ["localhost:9200"] }
  stdout { codec => rubydebug }
}
Edit the Kibana configuration file.
sudo nano /etc/kibana/kibana.ymlUncomment and modify the following lines from:
server.port: 5601
server.host: "0.0.0.0"
elasticsearch.hosts: ["http://localhost:9200"]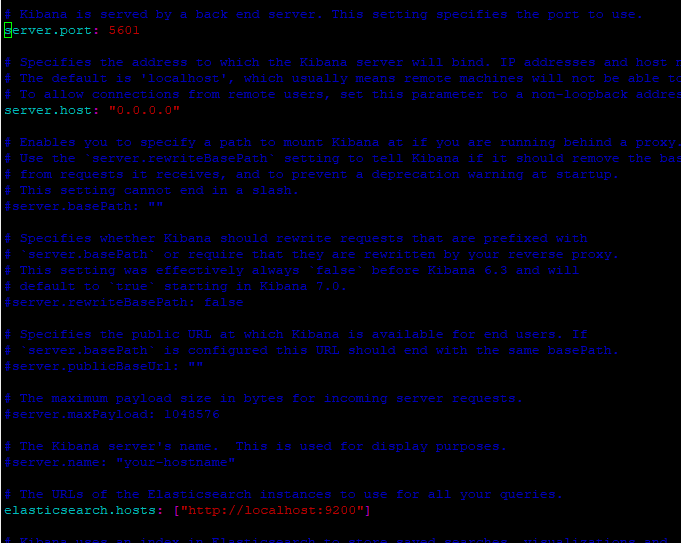
Start the Kibana service.
sudo systemctl start kibana
sudo systemctl enable kibana
sudo ufw allow 5601/tcp
Install and Configure Filebeat
Logon to web application :Point your web browser to the machine where you are running Kibana and specify the port number. For example, localhost:5601 or http://X.X.X.X:5601
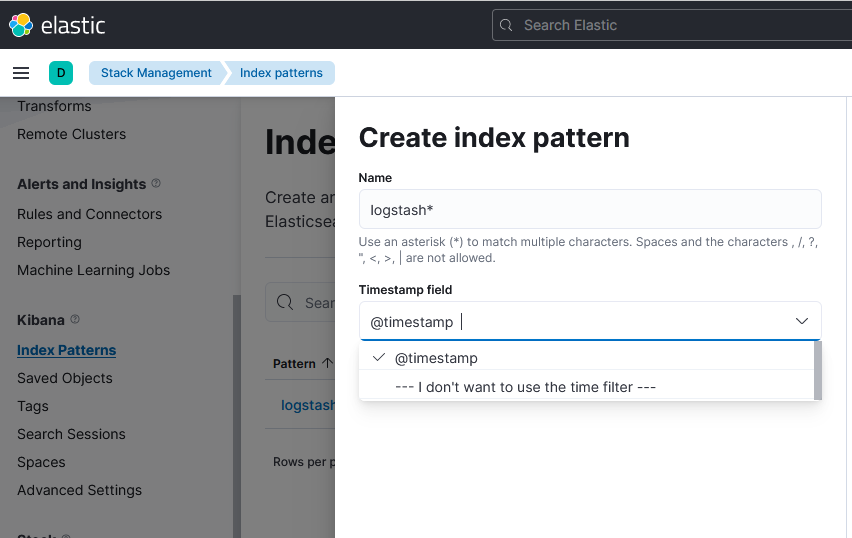
Creating an Index Pattern to Connect
- from the left panel, click Management > Kibana > Index patterns.
- In the Index patterns page, click Create index pattern.
- In the Index name or pattern field, enter an index name (logstash*)or pattern that matches the index pattern of the concepts and attributes loaded to Elasticsearch.
- Click Create to add the index pattern.
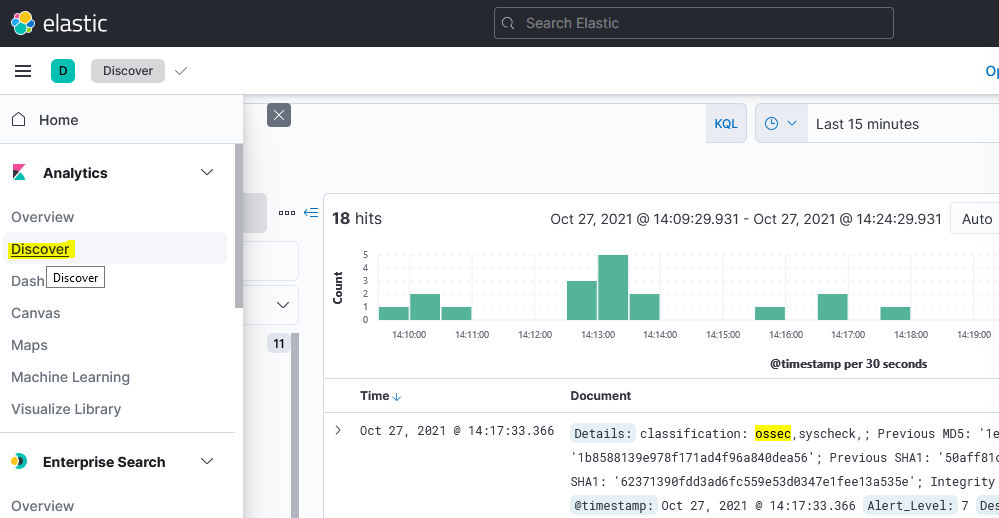
You can check ossec logs by click on discover tab in main menu bar.