tcpdump is a data-network packet analyzer computer program. It allows the user to display network packets (including TCP/IP) being transmitted or received over a network. In this short article I will show how to do some packet capture for network traffic analysis with tcpdump.
List network interfaces
Tcpdump needs access to your network card, so run the following commands as root (with su or sudo). To print the list of the network interfaces available on the system and on which tcpdump can capture packets run
# tcpdump -D
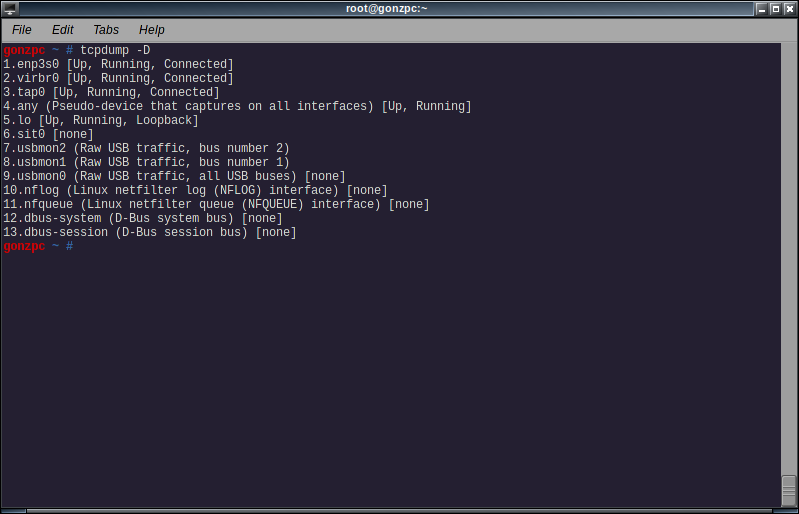
In my case, I will use the ‘real’ nic, enp3s0.
Capturing packets
Open a web browser (just to generate some network traffic) and run the following command:
# tcpdump -i <interface>
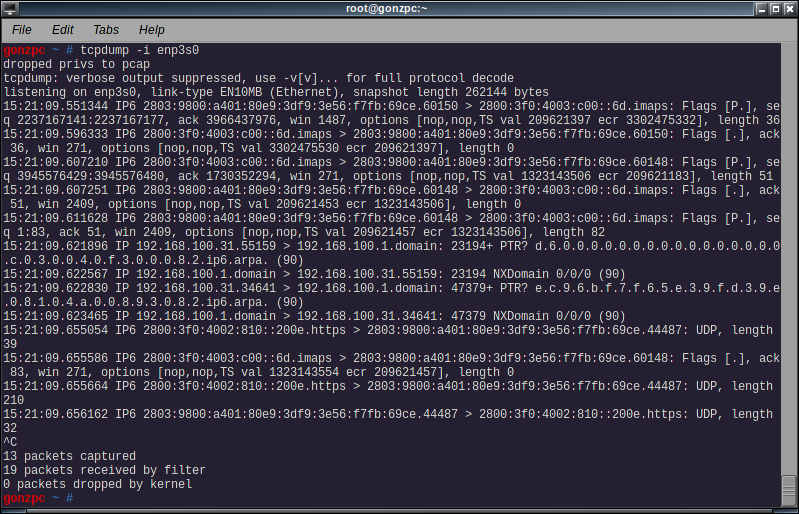
Even without a site opened maybe you will see some network activity. Maybe that “some” means a lot of network activity. Exit with ctrl-c and take a look at the results. The output shows a packet per line, with the following information:
- Timestamp
- Protocol (IP6 for IPv6, IP for IPv4)
- Origin host (ip or hostname) and port
- Destination host (also ip or hostname) and port
- TCP flags
- Sequence number
- ACK number
- Window size
- TCP options
- Data lenght
Limiting the output
tcpdump -i <interface> -c <n>
With this command the program will exit after receive n packets
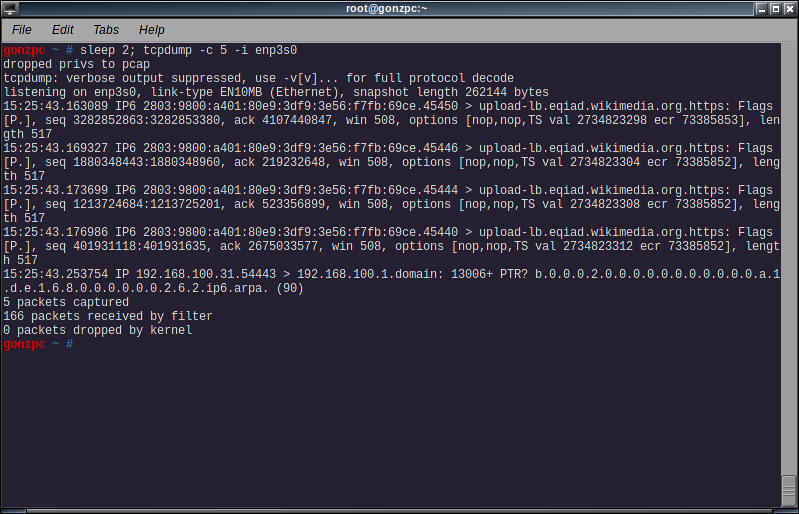
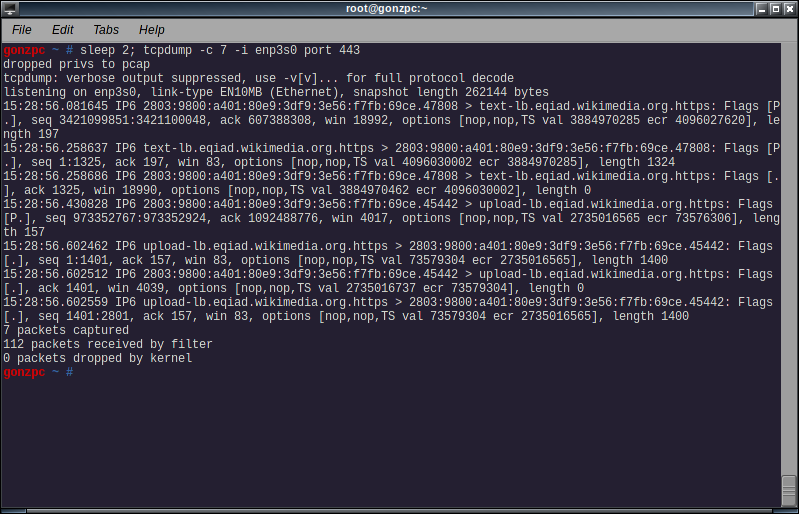
On the screenshot you can see a sleep 2 command running before tcpdump. This was just to give myself 2 seconds to load wikipedia on my browser. But it’s the same type of output as before.
Hide names
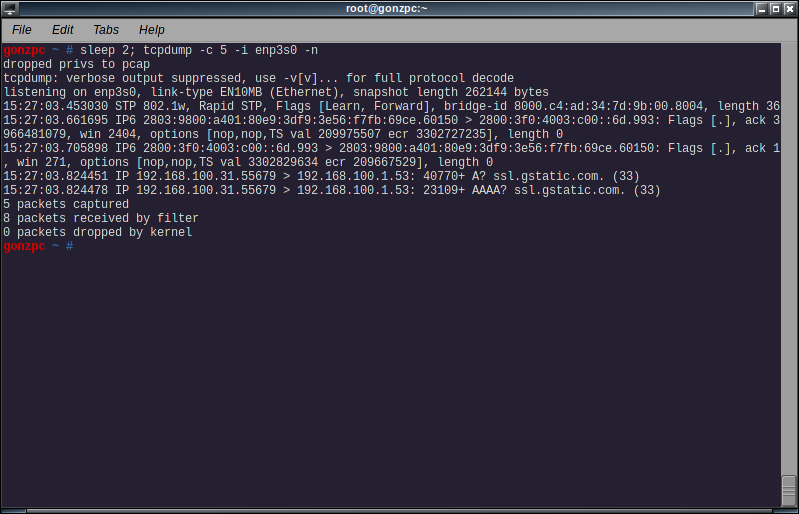
tcpdump -i <interface> -n
With the -n switch, tcpdump will not convert ip address or port numbers to names.
Filters
You can instruct tcpdump to capture only certain packets. For example to capture only https packets, or more precisely packets to port 443, add the expression:
tcpdump -i <interface> port <portnumber or portname>
We can also capture packets to or from some host with the following expression
tcpdump -i <interface> host <ip address or hostname>
Or we can capture packets of some protocol with:
tcpdump -i <interface> proto <protocol>
Where protocol can be one of: icmp, icmp6, igmp, igrp, pim, ah, esp, vrrp, udp or tcp. For icmp, tcp and udp you can omit the keyword proto.
We can also combine several expressions with ‘and’ (or ‘&&’), ‘or’ (or ‘||’) and not (or ‘!’) and group them with parentheses. There is a lot more filters you can create, check the pcap-filter manpage (man pcap-filter) for the get help on the syntax.
Increase output verbosity
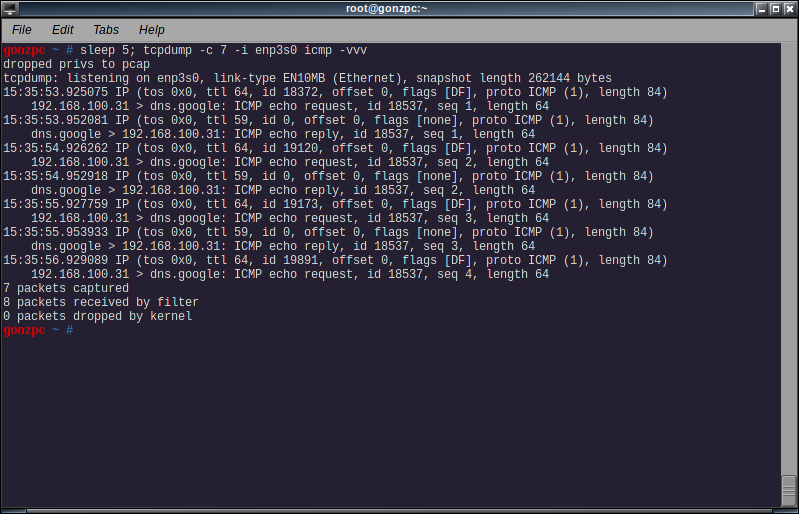
Use the -v parameter to increase verbosity. From the tcpdump manpage:
-v When parsing and printing, produce (slightly more) verbose output. For example, the time to live, identification, total length and options in an IP packet are printed. Also enables additional packet integrity checks such as verifying the IP and ICMP header checksum.
-vv Even more verbose output. For example, additional fields are printed from NFS reply packets, and SMB packets are fully decoded.
-vvv Even more verbose output. For example, telnet SB … SE options are printed in full. With -X Telnet options are printed in hex as well.
Save the capture to a file
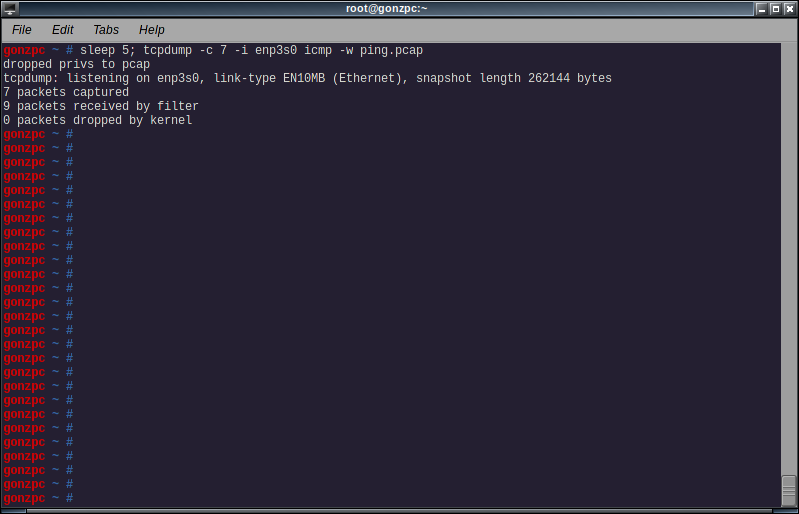
To write the packets to a file for later analysis add -w to the command line:
tcpdump -i <interface> -w <filename>
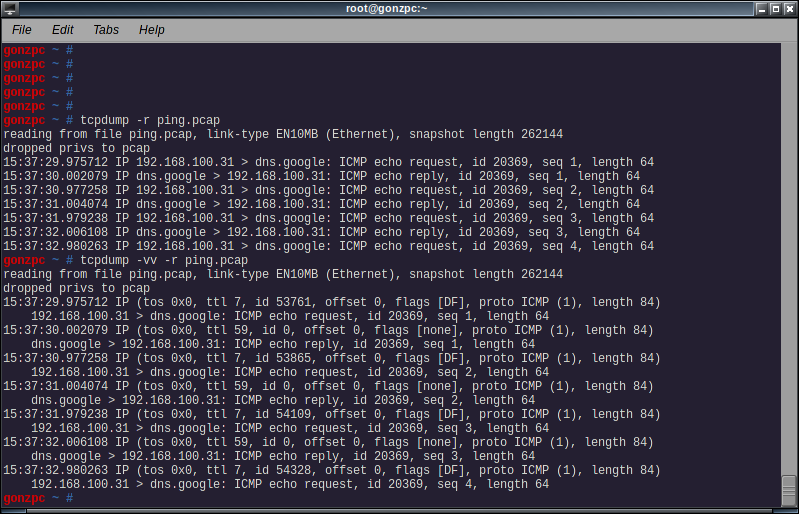
You can read that file later with the -r flag
tcpdump -r <file>
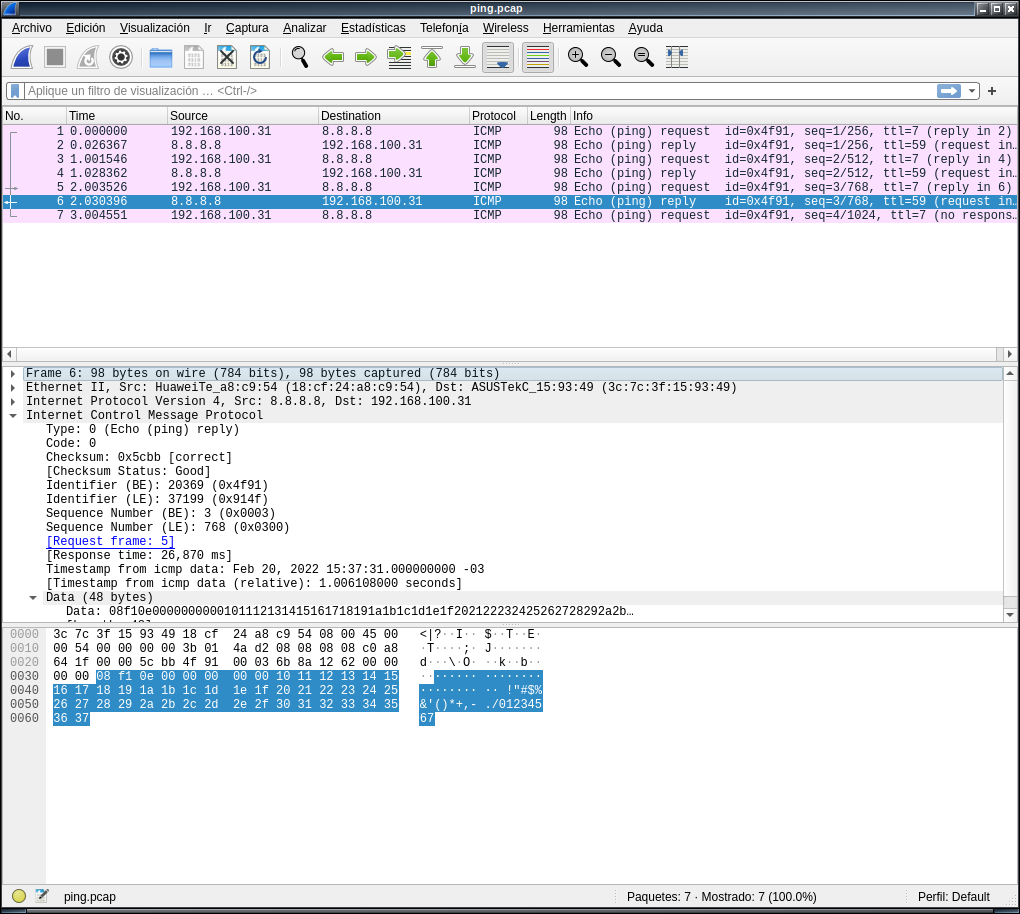
Or you can open that file later with some GUI tool, like wireshark.
Wait a second… wireshark can also capture network packets, why I didn’t use from the begining?.
True, wireshark can capture packets, and the output is also a lot more clear and easier to follow and read. With wireshark I don’t even have to memorize a command line, or keep in hand the manpage, blog article or at least a cheatsheet. Also true. I could have used wireshark rather than do the network traffic analysis with tcpdump. But sometimes I need to do the capture on a server or a router, and in that kind of computers I don’t want to waste some precious cpu cycles or memory bits in drawing windows, or colors, or buttons or some other GUI widgets.
And that’s why I choose to do the network traffic analysis with tcpdump on the command line if I’m in a hurry. Or save the output to a file that I transfer to do it with wireshark.