
This post is about How to visualize disk usage on Linux using Baobab
Disk Usage Analyzer, formerly known as Baobab, is a graphical disk usage analyzer for the GNOME desktop environment. It was part of gnome-utils, but has been a standalone application since GNOME 3.4.
Disk Usage Analyzer (also known as baobab) scans folders, devices or remote locations and and reports on the disk space consumed by each element. It provides both a tree-like and a graphical representation.
So, Baobab is a GNOME disk usage analyzer. Its biggest advantage is the intuitive visualization interface. Baobab can analyze the whole file system tree, a particular directory tree or even remote folders over network.
Install Baobab to visualize disk usage
- To install Baobab on Ubuntu, Debian:
sudo apt-get install baobabyum install baobabVisualize Disk Usage with Baobab
To start baobab from the terminal
baobab [path of the directory you want to analyze]OR just write baobab
baobabBaobab informs us with the result of disk usage analysis in two forms.
So Baobab supports two different visualization methods.
per-directory disk utilization stats are reported in numbers in the left panel, and the overall disk utilization is visualized in the right panel as shown below
Rings Chart
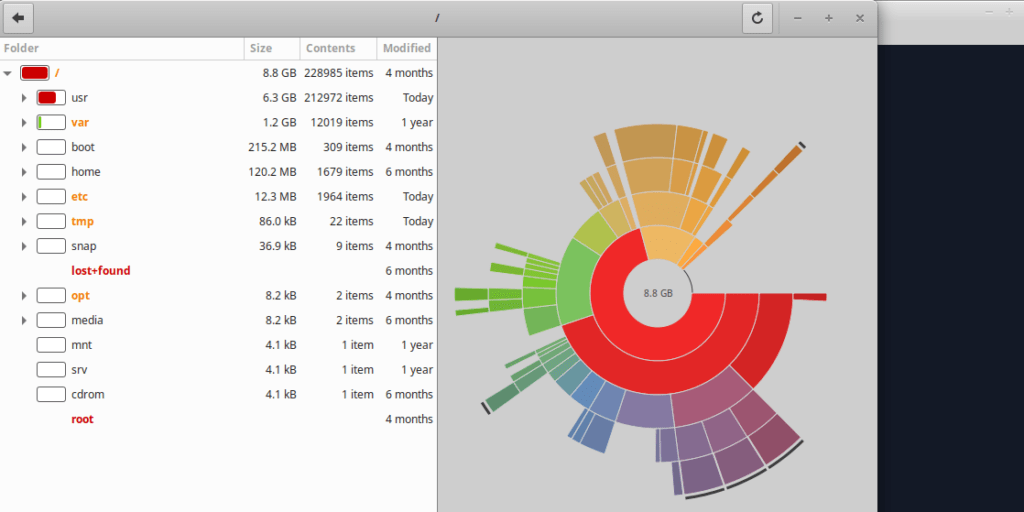
Selecting a folder will display its contents in a graphical form in the right hand panel as either a ‘Rings‘ chart or a ‘Treemap‘ chart depending on which type of display has been selected.
NOTE:
In addition to, In the ring chart, multiple circles indicate directories in the directory tree, and the center of the circles refers to the root of the directory tree.
The smaller a circle is, the higher a corresponding directory ranks in the directory hierarchy.
Moveing your mouse on any particular directory, that will display the names of its sub-directories.
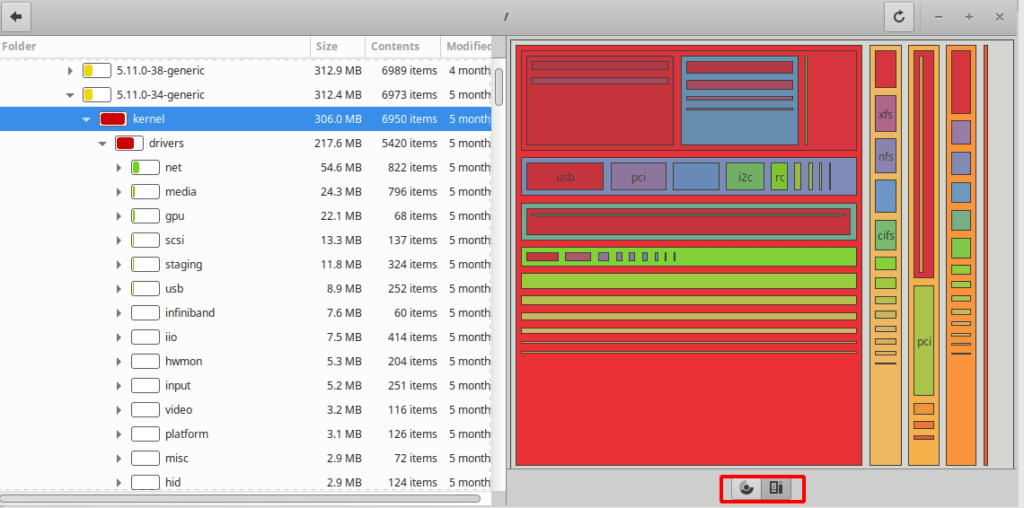
Treemap Charts
Treemap chart is one of the two types of visualization mode of Baobap where displaying rectangles which used to visualize the hierarchical structure of directories.
The outer rectangle refers to the root of the directory tree, and the inner rectangles to sub-directories. The size of each rectangle is meaning the size of a sub-directory.
NOTE:
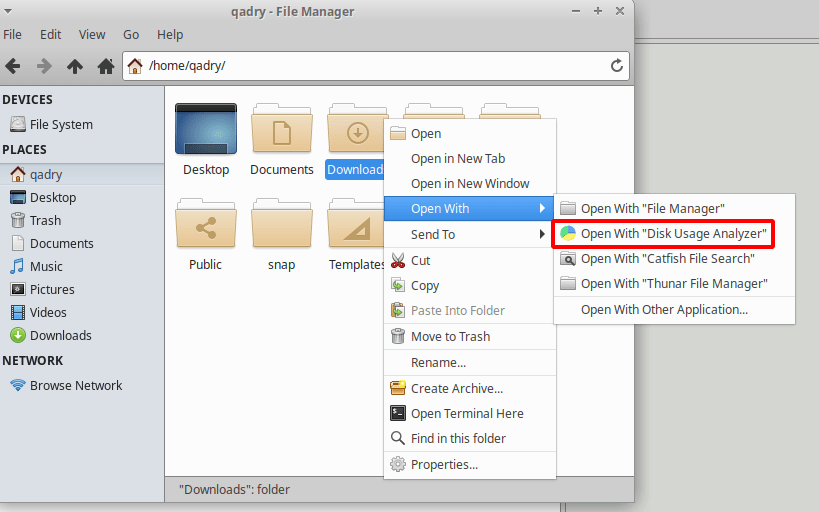
Also you can use Baobab’s visual disk usage analyzer via file manager.
So perform a right-click on a folder then choose “Open with Disk Usage Analyzer” menu as shown below
Conclusion
That’s it
In this guide, we illustrated how to visualize disk usage on Linux using Baobab.
Thanks