
Logwatch is an open-source log analyzer that scans through system logs and sends out a summary report of important system activity via email or other channels. This makes it easy to monitor and manage system logs, and quickly identify potential security threats or other issues. In this article, we will walk you through the process of installing and configuring Logwatch on Ubuntu 22.04 LTS.
Step 1:
Update your system Before we begin, it is important to update your Ubuntu system to ensure that you have the latest packages and security updates installed. You can do this by running the following command in your terminal:
sudo apt update && sudo apt upgradeStep 2:
Install Logwatch Once your system is up-to-date, you can proceed with installing Logwatch. To do this, simply run the following command:
sudo apt install logwatch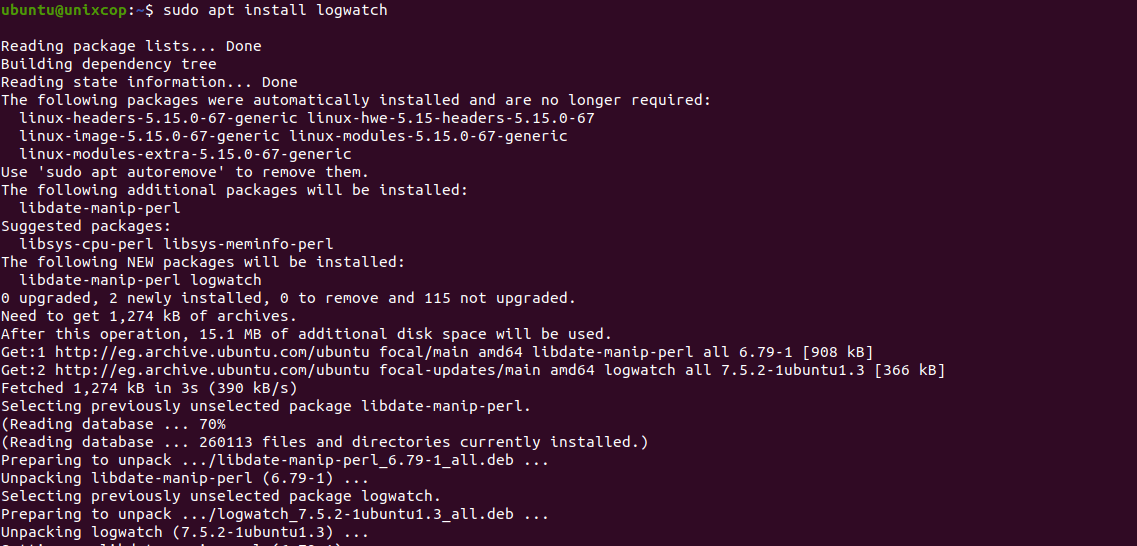
Step 3:
Configure Logwatch By default, Logwatch is configured to send out email reports to the root user. If you want to receive the reports via email, you will need to configure the email settings. To do this, you will need to edit the Logwatch configuration file, which is located at /usr/share/logwatch/default.conf/logwatch.conf.
Open the file in your text editor:
sudo vim /usr/share/logwatch/default.conf/logwatch.confFind the line that starts with MailTo and update the email address to the one you want to receive the reports. You can also configure other settings in this file, such as the frequency of the reports and which log files to scan.
Once you have made your changes, save the file and exit the text editor.
Step 4:
Test Logwatch To test that Logwatch is working correctly, you can run the following command:
sudo logwatch --detail High --mailto <your-email-address>This will generate a log report and send it to the email address you specified. You should receive an email with a summary of system activity for the past day.
Step 5:
Schedule Logwatch Reports To ensure that you receive regular Logwatch reports, you can schedule them to run automatically using a cron job. To do this, create a new file in the /etc/cron.daily/ directory:
sudo vim /etc/cron.daily/logwatchAdd the following lines to the file:
#!/bin/sh
/usr/sbin/logwatch --output mail --mailto <your-email-address> --detail High
Save the file and exit the text editor. This will schedule Logwatch to run every day and send you a daily report via email.
Also to run the Logwatch manually at any time, you can use the command below:
sudo logwatch
Example output from our server:
ubuntu@unixcop:~$ sudo logwatch
################### Logwatch 7.5.2 (07/22/19) ####################
Processing Initiated: Sat May 13 21:04:49 2023
Date Range Processed: yesterday
( 2023-May-12 )
Period is day.
Detail Level of Output: 0
Type of Output/Format: stdout / text
Logfiles for Host: unixcop
##################################################################
--------------------- Kernel Begin ------------------------
WARNING: Kernel Errors Present
xhci_hcd 0000:00:14.0: xHC error in resume, USBST ...: 1 Time(s)
---------------------- Kernel End -------------------------
--------------------- Connections (secure-log) Begin ------------------------
**Unmatched Entries**
PackageKit: uid 1000 is trying to obtain org.freedesktop.packagekit.system-sources-refresh auth (only_trusted:0): 4 Time(s)
PackageKit: uid 1000 obtained auth for org.freedesktop.packagekit.system-sources-refresh: 4 Time(s)
systemd-logind: Operation 'sleep' finished.: 1 Time(s)
---------------------- Connections (secure-log) End -------------------------
--------------------- Disk Space Begin ------------------------
Filesystem Size Used Avail Use% Mounted on
/dev/sda4 151G 40G 104G 28% /
/dev/loop0 128K 128K 0 100% /snap/bare/5
/dev/loop12 66M 66M 0 100% /snap/gtk-common-themes/1519
/dev/loop5 117M 117M 0 100% /snap/core/14946
/dev/loop13 46M 46M 0 100% /snap/snap-store/638
/dev/loop24 390M 390M 0 100% /snap/telegram-desktop/4759
/dev/loop23 54M 54M 0 100% /snap/snapd/19122
/dev/loop26 321M 321M 0 100% /snap/vlc/3078
/dev/loop28 56M 56M 0 100% /snap/core18/2745
/dev/loop17 48M 48M 0 100% /snap/pixelorama/163
/dev/loop3 56M 56M 0 100% /snap/core18/2721
/dev/loop8 93M 93M 0 100% /snap/whatsapp-for-linux/55
/dev/loop25 54M 54M 0 100% /snap/snapd/18933
/dev/loop4 74M 74M 0 100% /snap/core22/634
/dev/loop20 165M 165M 0 100% /snap/gnome-3-28-1804/194
/dev/loop6 73M 73M 0 100% /snap/core22/617
/dev/loop14 655M 655M 0 100% /snap/rubymine/354
/dev/loop21 64M 64M 0 100% /snap/whatsapp-for-linux/56
/dev/loop11 350M 350M 0 100% /snap/gnome-3-38-2004/140
/dev/loop7 117M 117M 0 100% /snap/core/14784
/dev/loop19 165M 165M 0 100% /snap/gnome-3-28-1804/198
/dev/loop15 350M 350M 0 100% /snap/gnome-3-38-2004/137
/dev/loop29 390M 390M 0 100% /snap/telegram-desktop/4762
/dev/loop1 64M 64M 0 100% /snap/core20/1852
/dev/loop9 92M 92M 0 100% /snap/gtk-common-themes/1535
/dev/loop10 158M 158M 0 100% /snap/spotify/64
/dev/loop16 157M 157M 0 100% /snap/spotify/63
/dev/loop2 64M 64M 0 100% /snap/core20/1879
/dev/sda1 920M 267M 590M 32% /boot
/dev/sda3 953M 5.3M 947M 1% /boot/efi
/dev/loop30 13M 13M 0 100% /snap/snap-store/959
/dev/sda8 306G 293G 14G 96% /media/ubuntu/New Volume
/dev/loop31 461M 461M 0 100% /snap/gnome-42-2204/102
/media/ubuntu/New Volume (/dev/sda8) => 96% Used. Warning: Disk Filling up.
---------------------- Disk Space End -------------------------
--------------------- lm_sensors output Begin ------------------------
radeon-pci-0400
Adapter: PCI adapter
temp1: N/A (crit = +120.0 C, hyst = +90.0 C)
BAT0-acpi-0
Adapter: ACPI interface
in0: 11.49 V
curr1: 2.04 A
coretemp-isa-0000
Adapter: ISA adapter
Package id 0: +103.0 C (high = +105.0 C, crit = +105.0 C)
Core 0: +103.0 C (high = +105.0 C, crit = +105.0 C)
Core 1: +98.0 C (high = +105.0 C, crit = +105.0 C)
acpitz-acpi-0
Adapter: ACPI interface
temp1: +99.0 C (crit = +128.0 C)
temp2: +0.0 C (crit = +128.0 C)
temp3: +46.0 C (crit = +128.0 C)
temp4: +53.0 C (crit = +128.0 C)
temp5: +43.0 C (crit = +128.0 C)
temp6: +84.0 C (crit = +128.0 C)
---------------------- lm_sensors output End -------------------------
###################### Logwatch End #########################
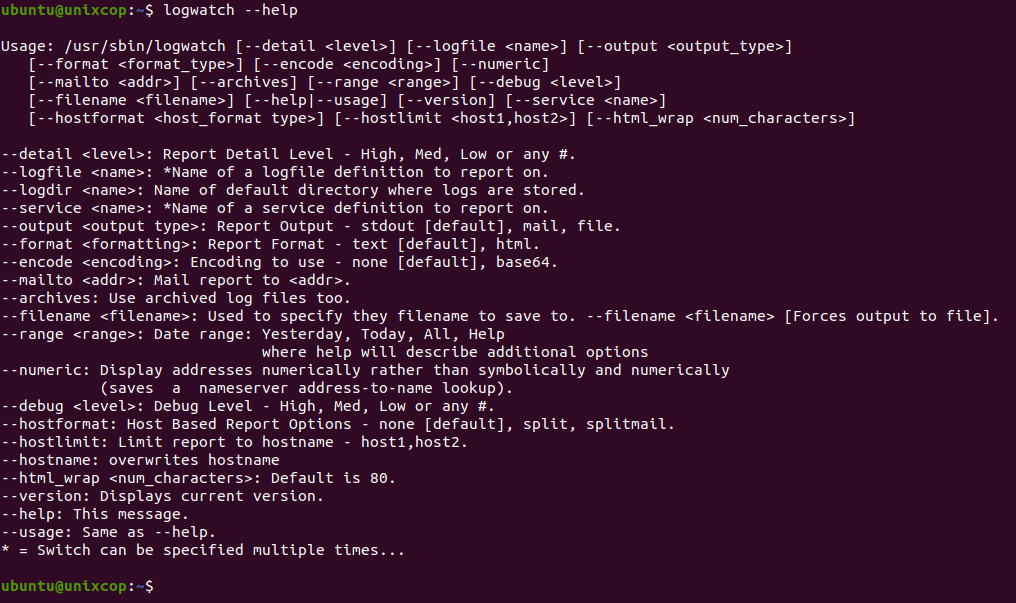
ubuntu@unixcop:~$A summary of the command-line switches described on the man page can be obtained with the ‘--help‘ option:
logwatch --help
Conclusion
Logwatch is a powerful tool for monitoring system logs and identifying potential security threats or other issues. By following the steps outlined in this article, you should be able to install and configure Logwatch on Ubuntu 22.04 LTS, and start receiving regular reports via email.