
TIG stack is one of the most popular monitoring tools available.
This stack is used with different data sources avaialble on operating system(linux, window), with different databases(mongoDB,mysql,influxDB) to collect performance metrics and time metrics.
Telegraf agent which is responsible to collect and aggregate all data like cpu,memory, IO usage from systems.
Influx DB is used to store all data in database and pass it to grafana dashboard.
Grafana is modern Dashboard which collects all data from Influx DB and represent in graphically on dashboard.
1. Install Telegraf and InfluxDB
step 1. Add Influxdata RPM repository:
Telegraf is created and maintained by influxDB organisation, if we configured influx DB repository we can install both applications.
cat <<EOF | sudo tee /etc/yum.repos.d/influxdb.repo |
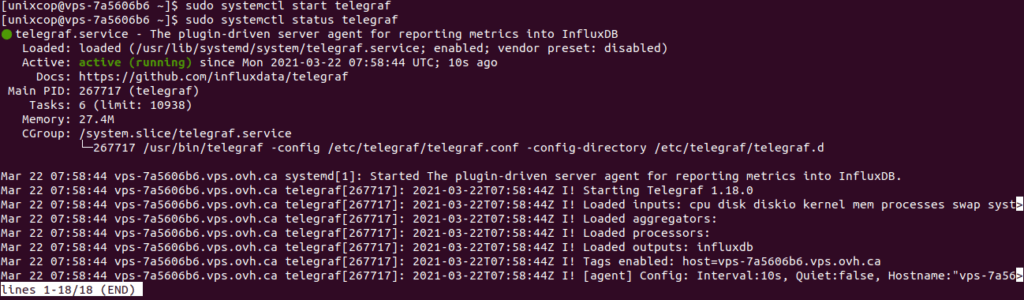
2. command to install and run telegraf service
$ sudo yum install telegraf |
more details about installation follow link https://unixcop.com/how-to-install-telegraf-on-centos-8/
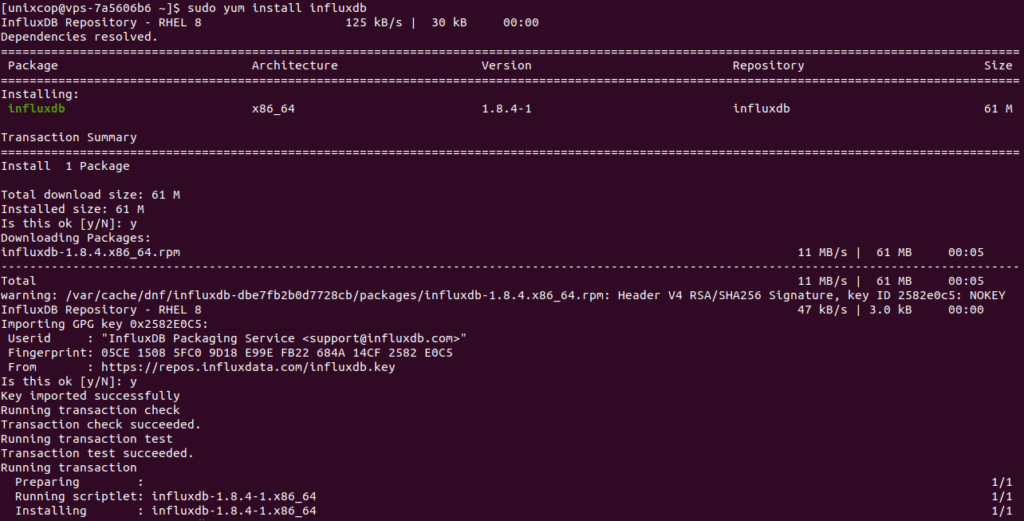
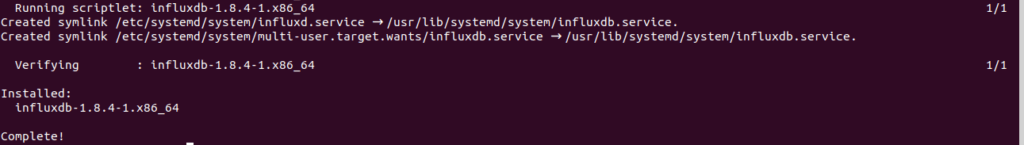
3. Install InfluxDB
$sudo yum install influxdb |
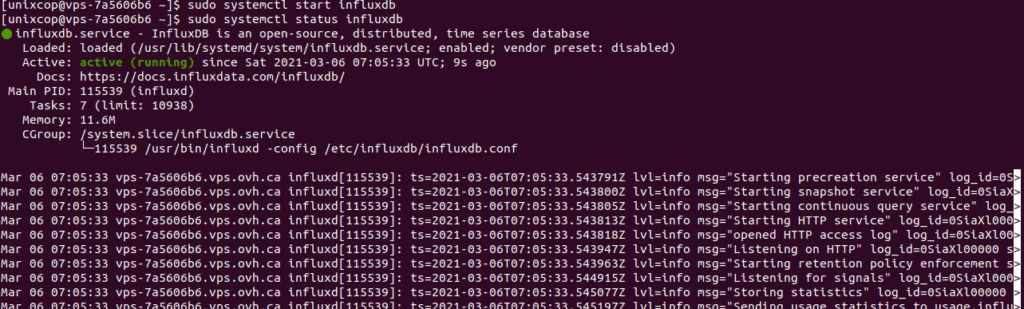
$sudo systemctl start influxdb |
after running command sudo systemctl status influxdb output look like this
service is active and in running state.
4. Installing Grafana on CentOS 8
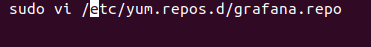
- Add Grafana RPM repository to your system.
- create new file grafana.repo using below command
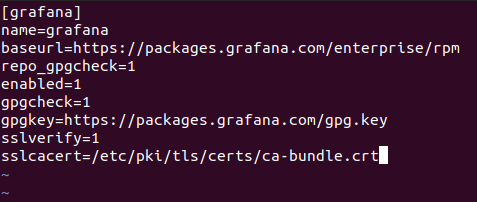
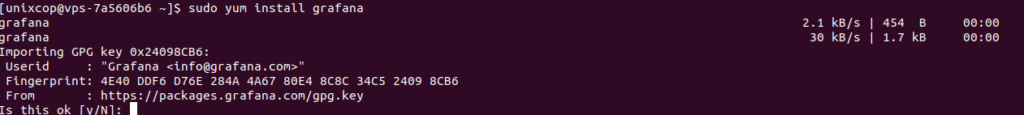
Once you are able to add repositories, install grafana rpm package.
$ sudo yum install grafana |
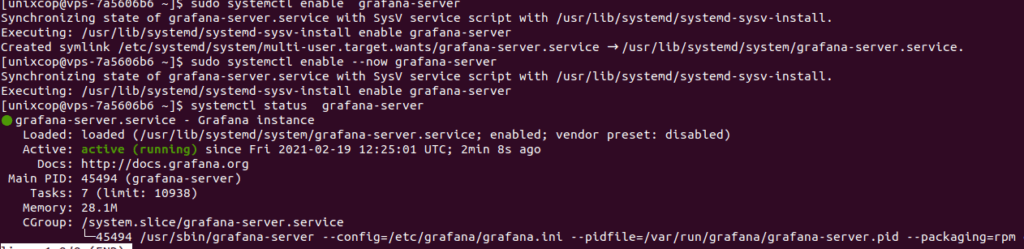
$ systemctl status grafana-server |
for more details follow link https://unixcop.com/install_grafana-on_centos8/
Setting up Telegraf configuration file
| # Configuration for sending metrics to InfluxDB [[outputs.influxdb]] urls = [ "http://influxdb:8086" |
[[inputs.http]] in this section we are just telling Telegraf to send a GET request every minute to added URL. we can define tags for the incoming data in telegraf. [[outputs.influxdb]] this section to send the data it gets from the input plugins. In this case it will send the data to influxdb:8086 insidea database called influx.
InfluxDB creation
login to influxDB and run below commands

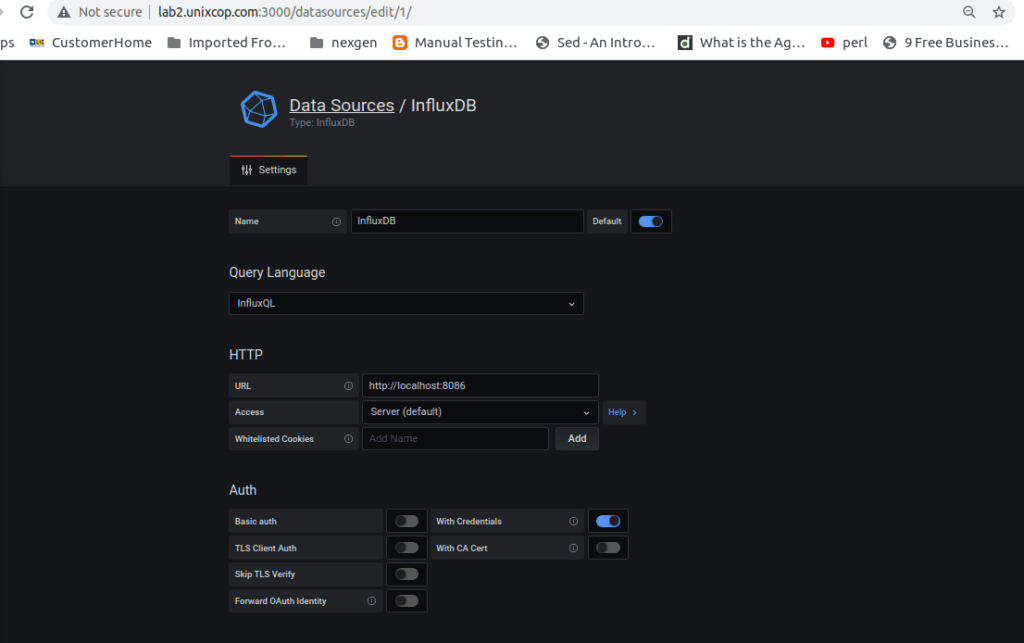
Add InfluxDB Datasource in grafana
Login to grafana dashboard
go to configuration > datasource > select influxDB datasource from list
Add data source Name
Influx DB URL
select any Authentication type from list
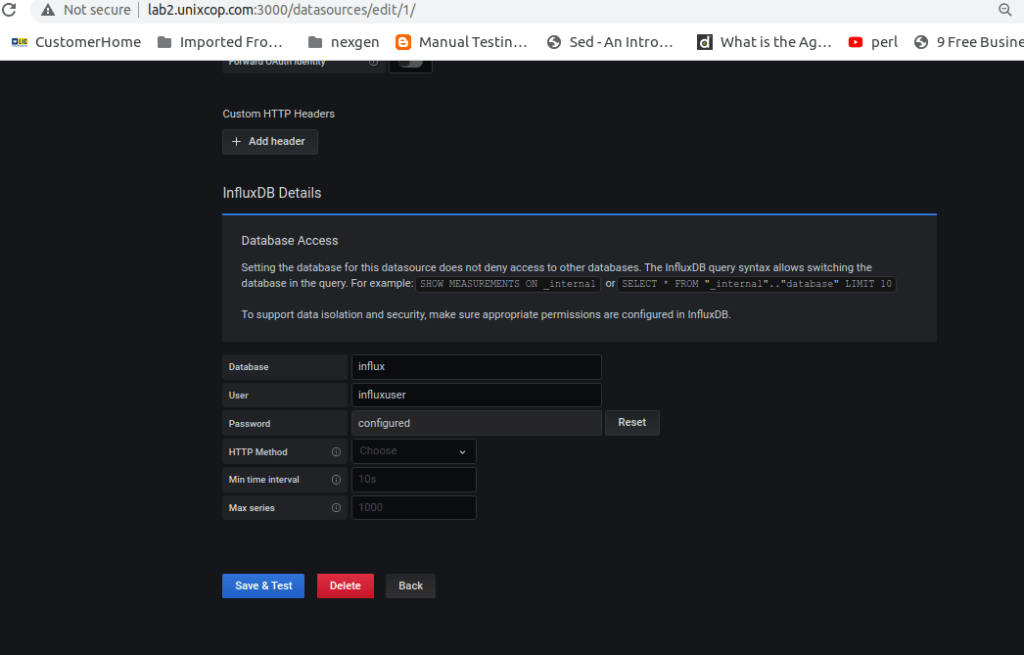
Add Database name, influxdb username and password
test and save data source.
you are ready to access influx DB time series in grafana.
Grafana Dashboard
Download telegraf dashboard as per your requirement form grafana site or you can create our own dashboard.
resource link https://grafana.com/grafana/dashboards
download Json file of dashboard from site and import that Json file in your dashboard

After importing dashboard will look like as below:
there is no data shown in dashboard as telegraf has not collected any data from
system and not store in influxDB. it shows blank on grafana dashboard.

Once telegraf start collecting data it will automatically displayed on dashboard.

in this way we can integrate TIG(telegraf+influx+grafana) stack.