
Grafana Loki is a log aggregation tool, and it is the core of a fully-featured logging stack.
Overview
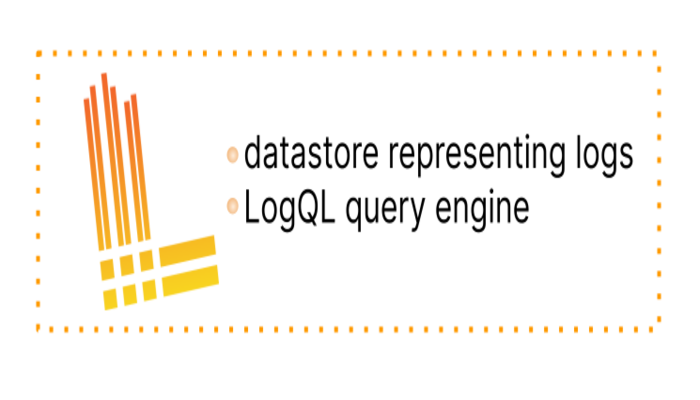
Loki is a datastore optimized for efficiently holding log data. The efficient indexing of log data distinguishes Loki from other logging systems. Unlike other logging systems, a Loki index is built from labels, leaving the original log message unindexed.
Loki features
- Efficient memory usage for indexing the logsBy indexing on a set of labels, the index can be significantly smaller than other log aggregation products. Less memory makes it less expensive to operate.
- Multi-tenancyLoki allows multiple tenants to utilize a single Loki instance. The data of distinct tenants is completely isolated from other tenants. Multi-tenancy is configured by assigning a tenant ID in the agent.
- LogQL, Loki’s query languageUsers of the Prometheus query language, PromQL, will find LogQL familiar and flexible for generating queries against the logs. The language also facilitates the generation of metrics from log data, a powerful feature that goes well beyond log aggregation.
- ScalabilityLoki can be run as a single binary; all the components run in one process.Loki is designed for scalability, as each of Loki’s components can be run as microservices. Configuration permits scaling the microservices individually, permitting flexible large-scale installations.
- FlexibilityMany agents (clients) have plugin support. This allows a current observability structure to add Loki as their log aggregation tool without needing to switch existing portions of the observability stack.
- Grafana integrationLoki seamlessly integrates with Grafana, providing a complete observability stack.
Install and run Grafana Loki locally
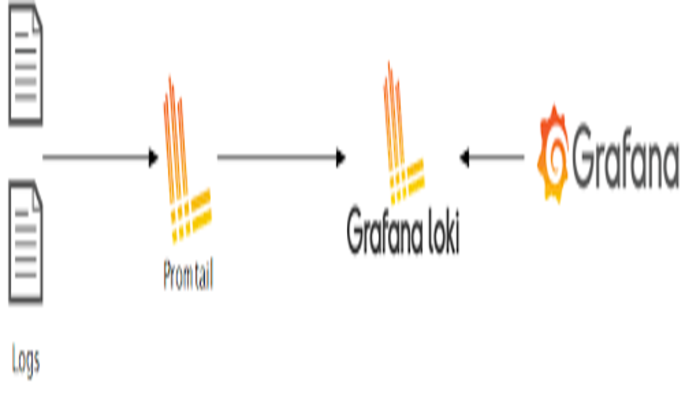
In order to log events with Grafana Loki, download and install both Promtail and Loki.
- Loki is the logging engine.
- Promtail sends logs to Loki.
The configuration specifies running Loki as a single binary.
Install
- Navigate to the release page.
- Scroll down to the Assets section under the version that you want to install.
- Download the Loki and Promtail .zip files that correspond to your system. Note: Do not download LogCLI or Loki Canary at this time. LogCLI allows you to run Loki queries in a command line interface. Loki Canary is a tool to audit Loki performance.
- Unzip the package contents into the same directory. This is where the two programs will run.
- In the command line, change directory (
cdon most systems) to the directory with Loki and Promtail. Copy and paste the commands below into your command line to download generic configuration files:
wget https://raw.githubusercontent.com/grafana/loki/master/cmd/loki/loki-local-config.yaml
wget https://raw.githubusercontent.com/grafana/loki/main/clients/cmd/promtail/promtail-local-config.yaml
just copy the below steps to install Loki
$ curl -O -L "https://github.com/grafana/loki/releases/download/v2.2.1/loki-linux-amd64.zip"
# extract the binary
$ unzip "loki-linux-amd64.zip"
# make sure it is executable
$ chmod a+x "loki-linux-amd64"
# download config file
$ wget https://raw.githubusercontent.com/grafana/loki/v2.2.1/cmd/loki/loki-local-config.yaml
just copy the below steps to install Promtail
$ curl -O -L "https://github.com/grafana/loki/releases/download/v2.2.1/promtail-linux-amd64.zip"
# extract the binary
$ unzip "promtail-linux-amd64.zip"
# make sure it is executable
$ chmod a+x "promtail-linux-amd64"
# download config file
$ wget https://raw.githubusercontent.com/grafana/loki/v2.2.1/cmd/promtail/promtail-local-config.yaml
We have completed the installation of Loki as well as Promtail and started them in the local machine. Let’s make some changes in the Grafana to view the logs.
Visualize the logs in Grafana
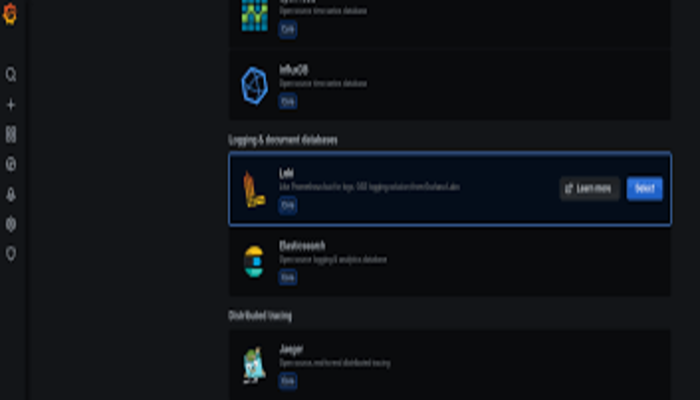
sudo service grafana-server startOnce Grafana is running click Settings->Datasource and then click Add Datasource and then select Loki
Once the data source is added click Loki again
Now add the URL as your localhost with port number 3100
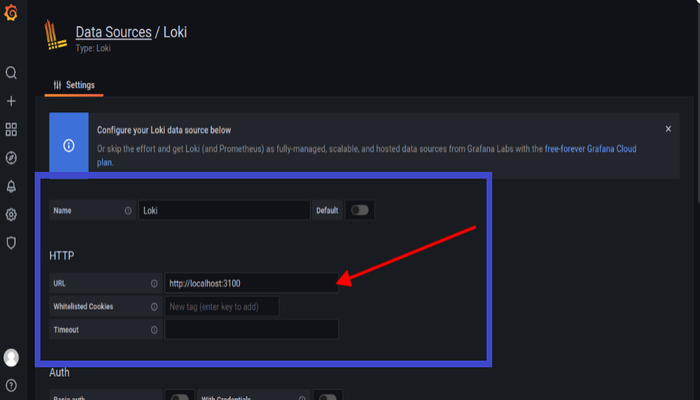
Now the Loki setup in Grafana is completed.