")
The gping tool takes the functionality of the ping tool and displays its data on a graph. With gping you can track the response time for hosts, and compare the data side by side. If you need to measure the response time of a host over time, gping is a tool for the task. With gping, you can ping multiple hosts simultaneously, making it easy to compare response times. You can customize how your gping graph displays information and it is able to graph the execution time of Linux commands. In this tutorial we will install gping and use it on your Linux system.
First, update your CentOS 8.
dnf update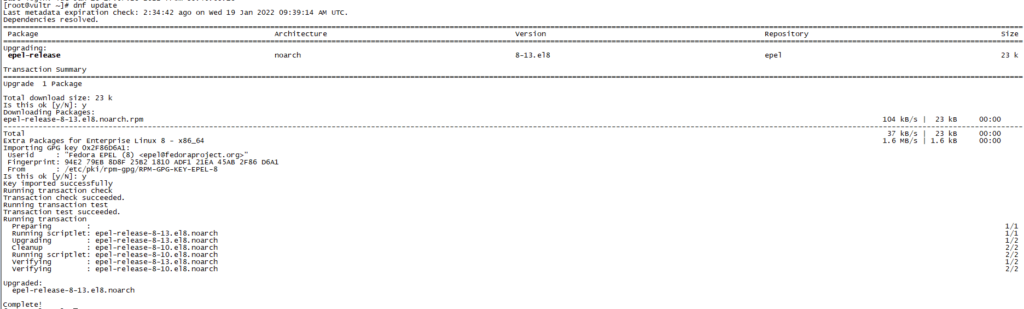
Now we will use SOPR tool to enable repository which we will use to install Gping.
dnf copr enable atim/gping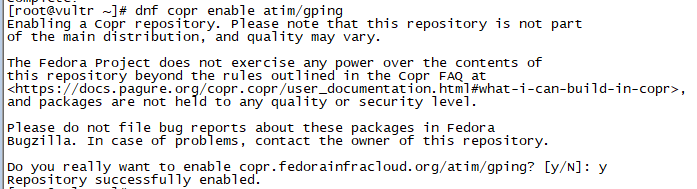
Install Gping using the following command:
dnf install gping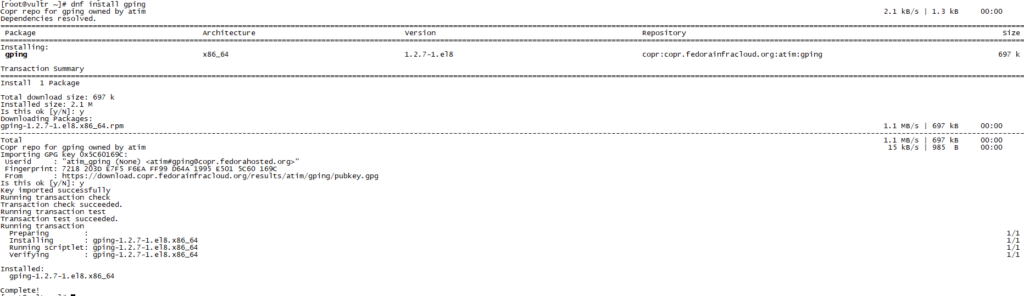
How to Use gping:
To use Gping type gping in your CLI followed by Hostname or IP Address.
In this example we will use google.com using Gping to analyze its graphical ping response.
gping google.com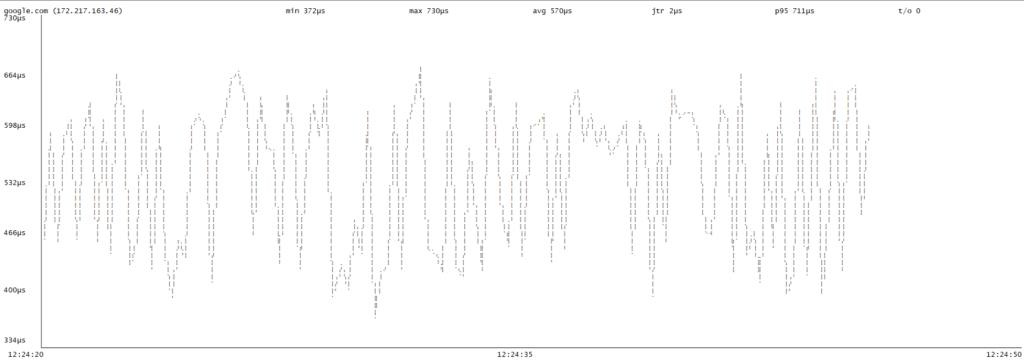
As you can see using Gping we have analyzed ping responce of google.com.
You can also use gping for graphic analysis of more than one host.
Use the following command:
gping google.com facebook.com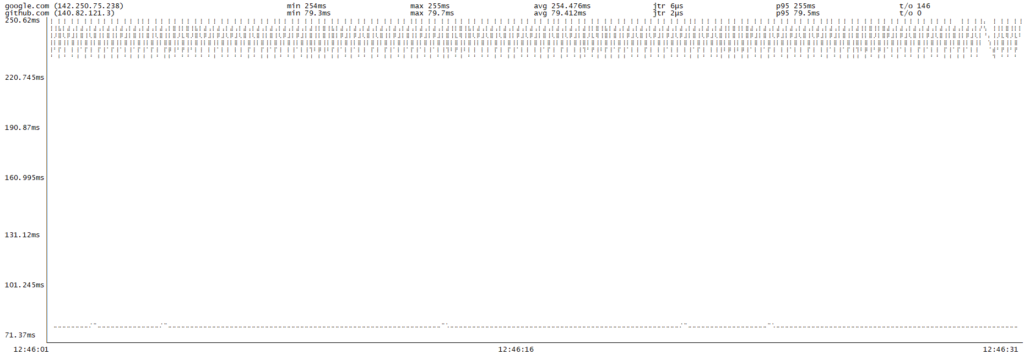
similarly you can increase buffer time using –buffer flag default is 30 seconds and also increase watch interval using –watch-interval flag default is 0.5 seconds.
gping google.com --buffer 60 --watch-interval 1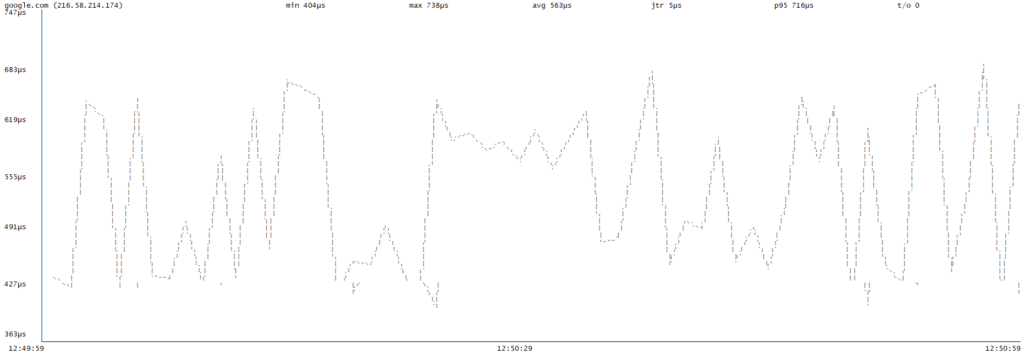
You can use Gping as per your need.