What is Grafana?
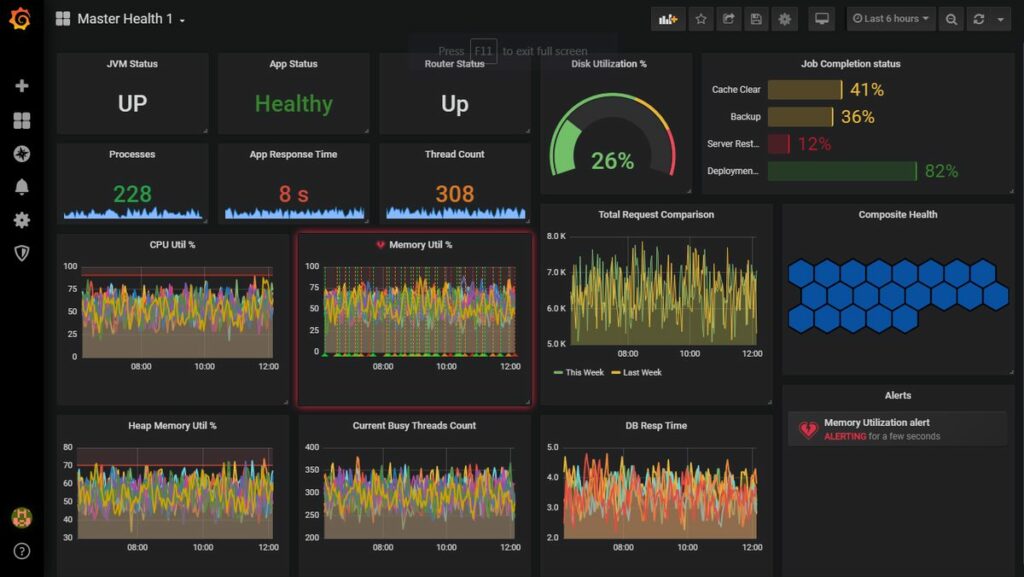
Grafana is an open-source visualization software. It allows you to create Dashboards based on input metrics. It provides you with tools to turn your time-series database (TSDB) data into graphs and visualizations.

What is Grafana HA?
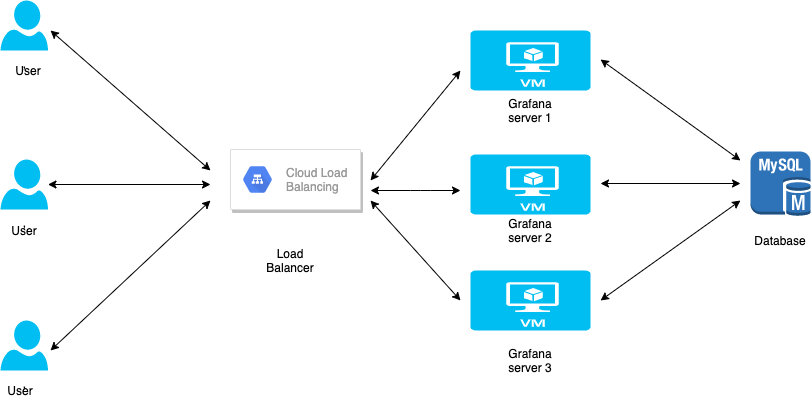
Grafana HA is a highly available and fault-tolerant cluster. In Grafana HA, the Grafana service runs on more than one server behind the load balancer. In case one of the servers is unavailable other servers are there which fulfill the user’s request.
Grafana HA Cluster (2 node) Setup steps:
Prerequisites:
Grafana requires a database to connect so that it can store its data. By default when you install Grafana it comes with MySQL but in the case of Grafana HA, we need a central MySQL DB where all Grafana servers can connect.
We will need the following hardware to create 2 node Grafana HA setup:
- 2 VMs for Grafana, with 4 cores, 15GB RAM, 50GB disk, Ubuntu 18.04
- 1 VM for MySQL, with 2 cores, 7.5GB RAM, 50GB disk, Ubuntu 18.04
Step 1: Install MySQL:
For storing Grafana data we will be using MySQL 5.7. To install MySQL on one of the VM with the help of the following commands:
sudo apt-get update
sudo apt-get install mysql-server -y
Step 2: Configuring MySQL:
Once the installation is completed we need to configure our MySQL. To configure the MySQL instance run the following command:
sudo mysql_secure_installationOnce we execute the above command MySQL will prompt us for various inputs.
The first prompt will ask whether you’d like to set up the Validate Password Plugin, which can be used to test the strength of your MySQL password. The second prompt will be to set a password for the MySQL root user. Enter and then confirm a secure password.
The third, fourth, and fifth options are to remove anonymous users and the test database and to disable remote root logins. The sixth option is to refresh the privileges so that all the changes get saved. Type Y for option four to option six.
Step 3: Create a database:
Create a database which will store the data with the help of following commands:
mysql> CREATE DATABASE prod_grafana;Step 4: Create a MySQL user:
Create a MySQL user which will connect to the Grafana database using the following commands:
> CREATE USER 'grafana_user'@'%' IDENTIFIED BY 'grafana_user_password';
> GRANT ALL ON prod_grafana.* TO 'grafana_user'@'%';
> FLUSH PRIVILEGES;
Step 5: Install Grafana:
On both the Grafana machines, we need to install the Grafana service. Execute the following commands to install the Grafana service:
sudo apt-get update
sudo apt-get upgrade -y
wget -q -O - https://packages.grafana.com/gpg.key | sudo apt-key add -
sudo add-apt-repository "deb https://packages.grafana.com/oss/deb stable main"
apt-cache policy grafana
sudo apt install grafana
Step 6: Configure Grafana:
Once Grafana is installed on both machines we need to configure it. To configure Grafana open /etc/grafana/grafana.ini and make the following changes:
domain=<your domain url>
#example, domain=grafana.unixcop.com
root_url=%(protocol)s://%(domain)s:%(http_port)s/
#example, root_url=https://grafana.unixcop.com
enable_gzip = true
[database]
url = mysql://grafana_user:grafana_user_password@<db_ip>:3306/prod_grafana
[remote_cache]
type = database
Step 7: Start Grafana Service:
After completing the changes in /etc/grafana/grafana.ini run the following commands to start the Grafana service on both the nodes:
systemctl start grafana-serverTo make it a default service run the following command:
systemctl enable grafana-serverStep 8: Create a LoadBalancer:
We need to create a load balancer to load balance the traffic between the two Grafana machines. We will be using Google’s Load Balancing service to create a load balancer. Refer to Create Load Balancer using GCP Load Balancing for a step-by-step process for GCP load balancer setup.
Step 9: Accessing Grafana:
Once your Load balancer created in Step 6 is up and running. Go to the browser and open the Grafana UI using https://<load_balancerip>
By default credentials will be admin/admin. Once you login you can change those.

With this you Grafana HA setup is up and running.
More about Grafana?. Please consult this link: https://unixcop.com/how-to-configure-grafana-on-centos-8/
Cheers!!


