In this guide, we will show you how to install Grafana on Fedora 36
Grafana is a multi-platformopen source analytics and interactive visualization web application. It provides charts, graphs, and alerts for the web when connected to supported data sources.
A licensed Grafana Enterprise version with additional capabilities is also available as a self-hosted installation or an account on the Grafana Labs cloud service. It is expandable through a plug-in system.
End users can create complex monitoring dashboards using interactive query builders. Grafana is divided into a front end and back end, written in TypeScript and Go, respectively.
Installation of Grafana on Fedora 36
Just follow the steps below to get start with Grafana
- Update your system packages as follows:
sudo dnf upgrade -y && sudo dnf update -y
- Grafana is available on Fedora 36 base repository. So run the below command to install it.
sudo dnf install grafana -y
- Enable and start Grafana server by running the following command:
sudo systemctl enable grafana-server
sudo systemctl start grafana-server
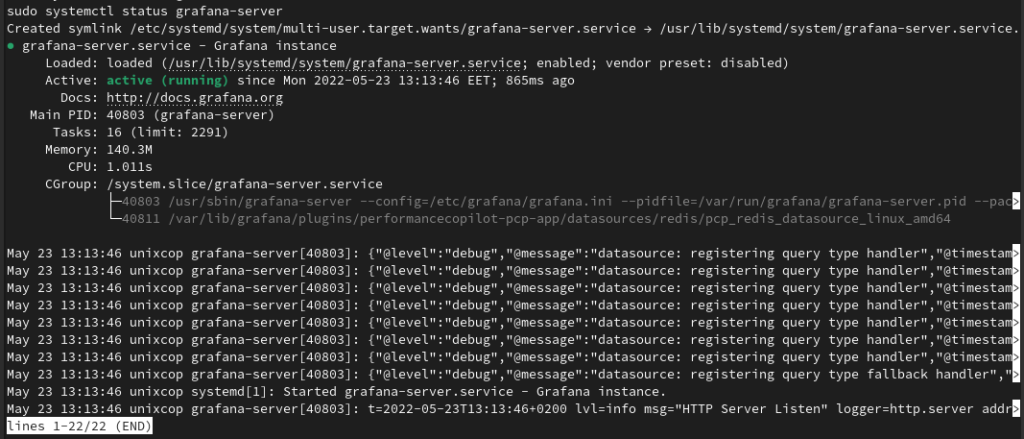
- Check status of Grafana after enabling and starting it
sudo systemctl status grafana-server

- Next step is to allow port 3000 in firewall to access the Dashboard of Grafana
sudo firewall-cmd --add-port=3000/tcp --permanent
sudo firewall-cmd --reload
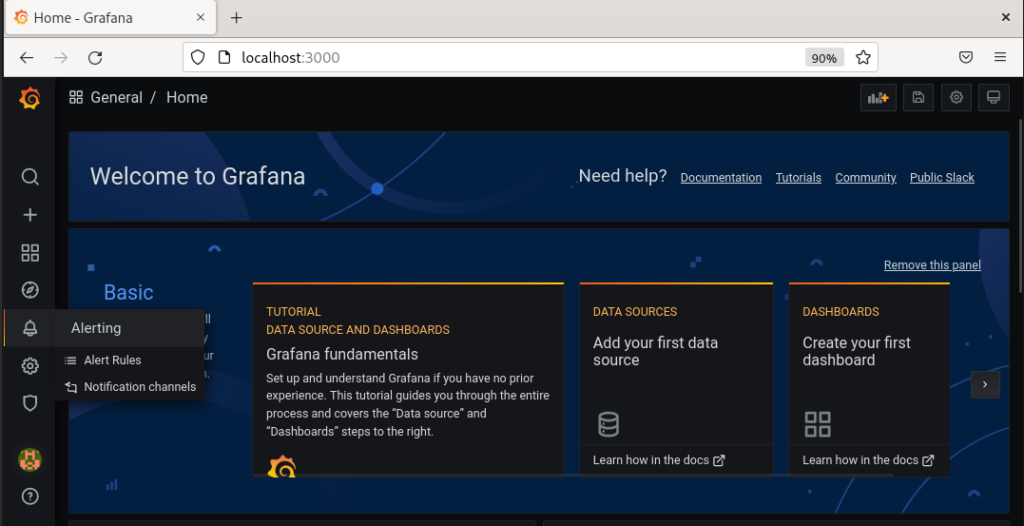
- Go to you favorite browser then type: http://localhost:3000 as shown below in the screenshot.
- You will be asked to login, so login with the admin default credentials:
username: admin
password: admin

- Also Grafana will oblige you to reset your password as follows:

- After that you will be directed to the Grafana’s Dashboard as shown below

Conclusion
That’s it
In this tutorial, we showed you how to install Grafana server on Fedora 36.
Also read: How to install Grafana on CentOS
How to install Grafana on Ubuntu
Grafana HA Cluster Setup
Thanks.


