
Introduction
Provides monitoring of all mission-critical infrastructure components, including applications, services, operating systems, network protocols, systems metrics, and network infrastructure. In addition, hundreds of third-party addons provide for monitoring of virtually all in-house applications, services, and procedures. Provides a central view of your entire IT operations network and business processes.
Nagios Xi has powerful dashboards that provide at-a-glance access to robust monitoring information and third-party data. Statements provide users with quick access to the information they find most useful. Automated, integrated trending, and capacity planning graphs allow organizations to plan for infrastructure upgrades before outdated systems catch them by surprise.
Alerts are sent to IT staff, business stakeholders, and end-users via email or mobile text messages, providing them with outage details to start resolving issues immediately.
Integrated web-based configuration interface lets admins hand out control of managing monitoring configuration, system settings, and more to end-users and team members quickly. Configuration wizards guide users through monitoring new devices, services, and applications – all without having to understand complex monitoring concepts.
Multi-user access to the web interface allows stakeholders to view relevant infrastructure status. User-specific views ensure clients only see the infrastructure components they’re authorized for. Advanced user management simplifies administration by enabling you to manage user accounts easily. Provision new user accounts with a few clicks, and users automatically receive an email with their login credentials. For more resources for Nagios xi and tutorial installation for Nagios.
Consolidating the monitoring
In the context of a change away from Nagios to an up-to-date solution, a good opportunity becomes available to fundamentally review your own IT monitoring procedures in addition to simply replacing the tool.
Disadvantages
After many years of use, employees in some companies have continually modified the Nagios instance and Nagios plug-ins. It may not have appropriately documented these changes. The monitoring process usually continues somehow, but basic knowledge about monitoring is often lacking.
This can result in blind spots and inefficient IT monitoring. A new tool should bring extensive auto-discovery functions for including possible assets that Nagios did not previously capture into the monitoring. Nagios does not automatically detect services by default, and implementation via extensions is tedious. However, because more and more systems need to be monitored, a good auto-discovery is an important criterion when choosing an alternative monitoring tool.
In addition, during a changeover, it is also worth checking whether certain assets are still relevant for your organization. In the same way, the question arises as to how a new and improved approach could monitor the systems. In an ideal scenario, a new software solution would be capable of incorporating existing Nagios plug-ins, but at the same time, it would also provide customized and better integrations. This is because some Nagios plug-ins are relatively old or poorly maintained. Other IT monitoring solutions bring better integrations for standard technologies, making monitoring more precise. These should then replace the old Nagios plug-ins.
Get image for Nagios XI server
This image is not suitable for production use. It doesn’t scale and all the components including MySQL are packed into one container.
# podman pull mavenquist/nagios-xi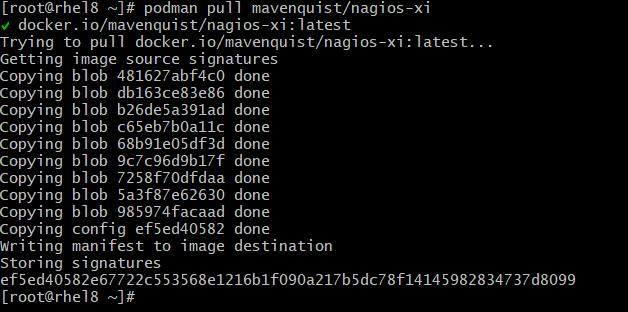
Application Setup
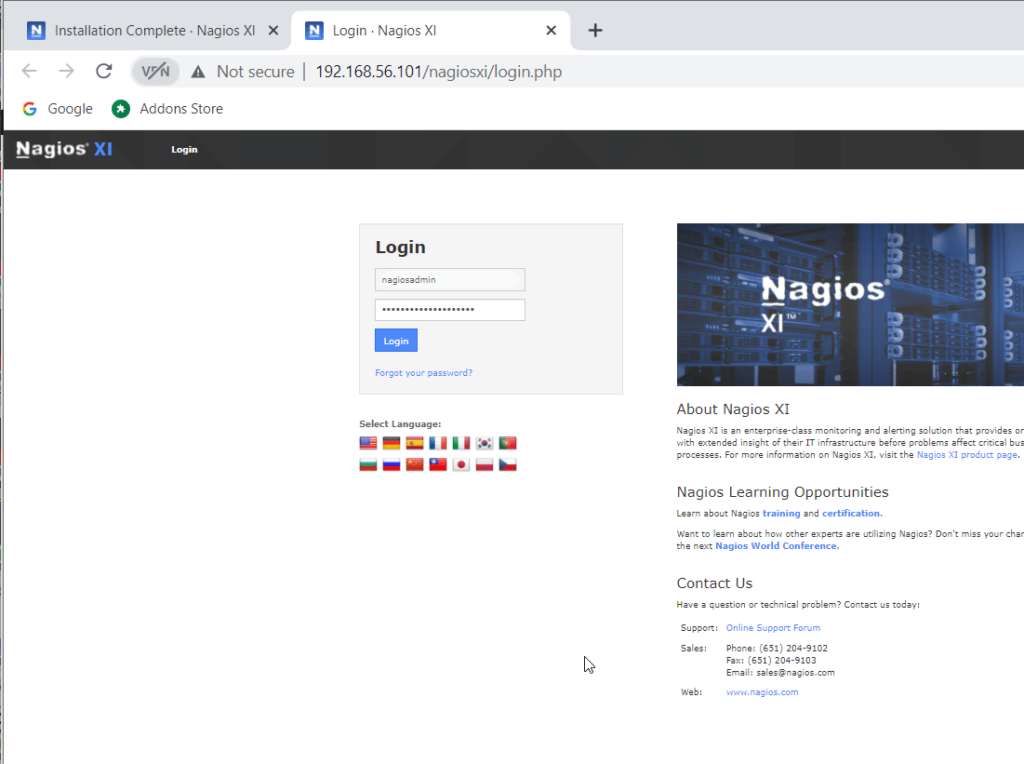
Access the WebUI at http://<your-ip>.
Create pod for Nagios XI server
# podman pod create --name nagiosxiapp -p 80:80 --network bridgeCreate the Nagios XI server container
# podman run --pod nagiosxiapp --name nagiosxi-server -d mavenquist/nagios-xi:latestCheck the nagios xi server URL from browser
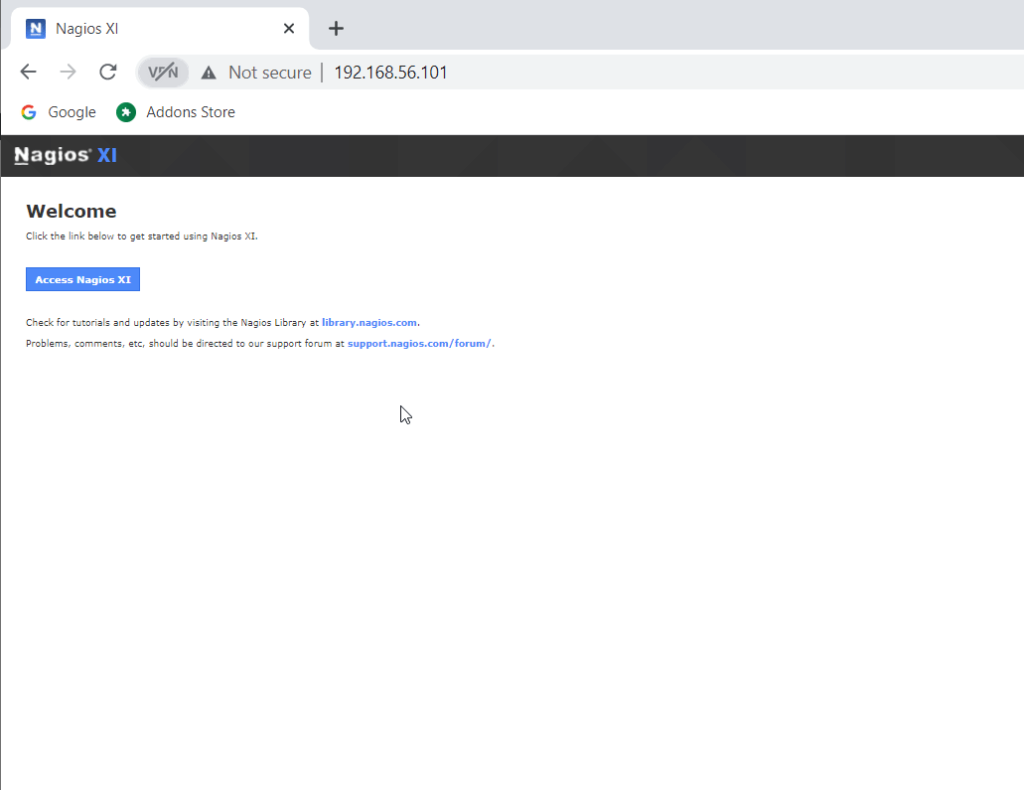
Configure the Nagios XI Server
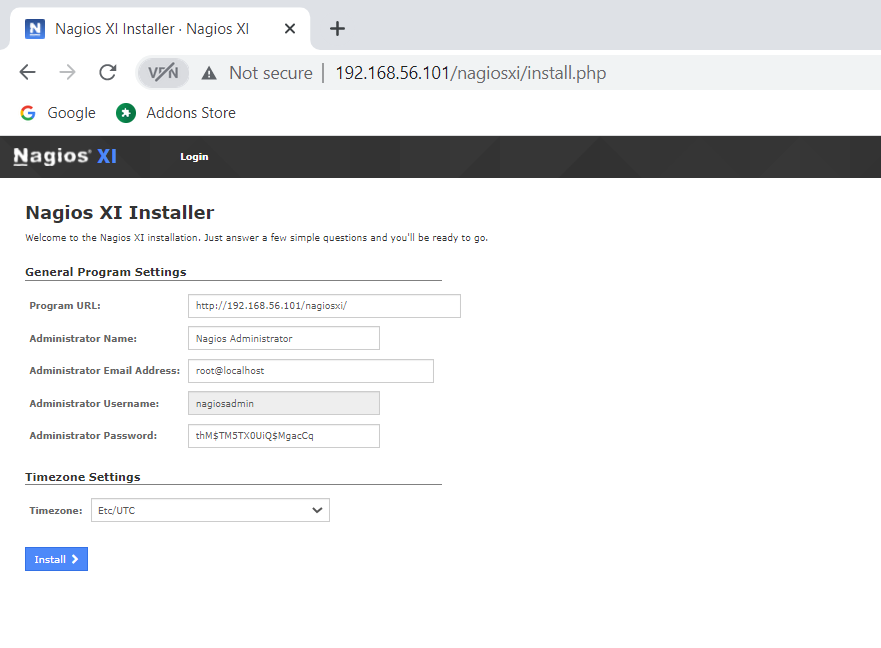
Complete the installation
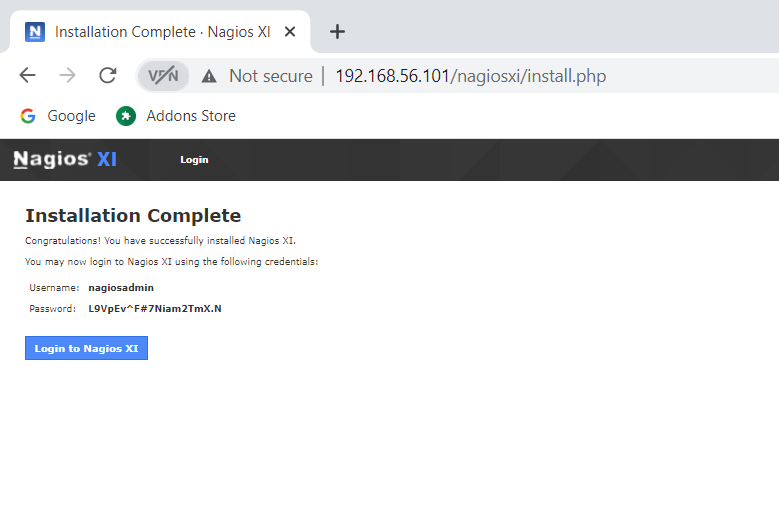
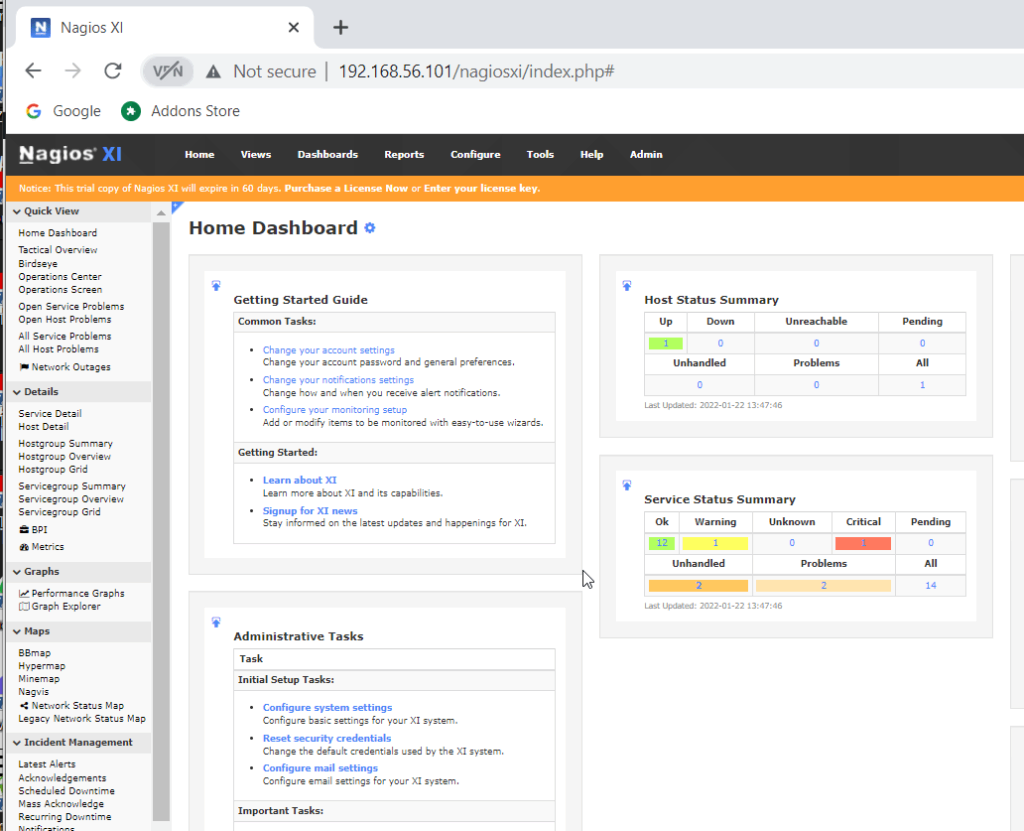
Login to the URL
Try now to navigate the WebUI
Conclusion
A monitoring tool inspects individual devices like routers, switches, servers, etc., within a network infrastructure. All the devices within the network infrastructure are connected to the network monitoring software. The monitoring tool then provides network admin with insights about the health and performance of network components. It alerts the network admin if there is an issue within the Network to be fixed immediately to maintain the network health and performance.