This post is about “Osquery integration with Wazuh”
What is osquery?
osquery is an operating system instrumentation framework for Windows, OS X (macOS), Linux, and FreeBSD. The tools make low-level operating system analytics and monitoring both performant and intuitive.
osquery exposes an operating system as a high-performance relational database. This allows you to write SQL queries to explore operating system data. With osquery, SQL tables represent abstract concepts such as running processes, loaded kernel modules, open network connections, browser plugins, hardware events or file hashes.
High Level Features
The high-performance and low-footprint distributed host monitoring daemon, osqueryd, allows you to schedule queries to be executed across your entire infrastructure. The daemon takes care of aggregating the query results over time and generates logs which indicate state changes in your infrastructure. You can use this to maintain insight into the security, performance, configuration, and state of your entire infrastructure. osqueryd‘s logging can integrate into your internal log aggregation pipeline, regardless of your technology stack, via a robust plugin architecture.
The interactive query console, osqueryi, gives you a SQL interface to try out new queries and explore your operating system. With the power of a complete SQL language and dozens of useful tables built-in, osqueryi is an invaluable tool when performing incident response, diagnosing a systems operations problem, troubleshooting a performance issue, etc.
osquery is cross-platform. Even though osquery takes advantage of very low-level operating system APIs, you can build and use osquery on Windows, macOS, Ubuntu, CentOS and other popular enterprise Linux distributions. This has the distinct advantage of allowing you to be able to use one platform for monitoring complex operating system state across your entire infrastructure. Monitor your corporate Windows or macOS clients the same way you monitor your production Linux servers.
Osquery integration with Wazuh
Wazuh agent can be integrated with Osquery, making it easy to capture additional information from the endpoint. This integration can be helpful for telemetry and threat hinging.
More information about using Osquery with Wazuh can be found in the Osquery section of our documentation.
Configuration
Configure your environment as follows to test the POC.
- Install Osquery on the monitored CentOS 8 endpoint.
yum install -y https://pkg.osquery.io/rpm/osquery-4.5.1-1.linux.x86_64.rpmAdd this content block to the Osquery configuration file /etc/osquery/osquery.conf.
{
"options": {
    "config_plugin": "filesystem",
    "logger_plugin": "filesystem",
    "utc": "true"
},

"schedule": {
    "system_info": {
        "query": "SELECT hostname, cpu_brand, physical_memory FROM system_info;",
        "interval": 3600
    },
    "high_load_average": {
        "query": "SELECT period, average, '70%' AS 'threshold' FROM load_average WHERE period = '15m' AND average > '0.7';",
        "interval": 900,
        "description": "Report if load charge is over 70 percent."
    },
    "low_free_memory": {
        "query": "SELECT memory_total, memory_free, CAST(memory_free AS real) / memory_total AS memory_free_perc, '10%' AS threshold FROM memory_info WHERE memory_free_perc < 0.1;",
        "interval": 1800,
        "description": "Free RAM is under 10%."
    }
},

"packs": {
    "osquery-monitoring": "/usr/share/osquery/packs/osquery-monitoring.conf",
    "incident-response": "/usr/share/osquery/packs/incident-response.conf",
    "it-compliance": "/usr/share/osquery/packs/it-compliance.conf",
    "vuln-management": "/usr/share/osquery/packs/vuln-management.conf",
    "hardware-monitoring": "/usr/share/osquery/packs/hardware-monitoring.conf",
    "ossec-rootkit": "/usr/share/osquery/packs/ossec-rootkit.conf"
    }
}
Edit /var/ossec/etc/ossec.conf on the monitored CentOS 8 endpoint and enable the Osquery wodle.
<ossec_config>
    <wodle name="osquery">
        <disabled>no</disabled>
        <run_daemon>yes</run_daemon>
        <bin_path>/usr/bin</bin_path>
        <log_path>/var/log/osquery/osqueryd.results.log</log_path>
        <config_path>/etc/osquery/osquery.conf</config_path>
        <add_labels>no</add_labels>
    </wodle>
</ossec_config>
Start Osqueryd service.systemctl start osquerydRestart the Wazuh agent to apply changes.
systemctl restart wazuh-agentSteps to generate the alerts
No action is required. Wazuh automatically reads the /var/log/osquery/osqueryd.results.log file and generates alerts based on these logs.
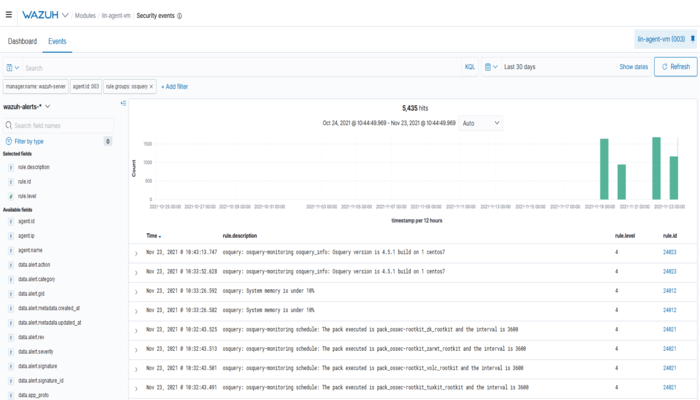
Query the alerts
You can visualize the alert data in the Wazuh Kibana plugin. To do this, go to the Security events module and add the filters in the search bar to query the alerts.