
Hello, friends. In this post, you will learn about iostat on Linux. This tool allows you to monitor CPU usage and provides information about input and output processes on the system.
The command iostat Reports Central Processing Unit (CPU) statistics and input/output statistics for devices, partitions, and network file systems (NFS).
The iostat command is used for monitoring system input/output device loading by observing the time the devices are active in relation to their average transfer rates.
This command is present in many Linux distributions, so sysadmins have it at their disposal for their tasks.
To provide as much useful information as possible, iostat generates two reports:
- On CPU utilization
- Report with I/O statistics of all disks.
In this way, you will be able to know how the disks behave and react to daily workloads.
To make these reports, iostat uses several files like /proc/diskstats , /proc/diskstats , /sys with a refresh rate that you can define without too many problems.
Let’s start.
Installing iostat on Linux
iostat is present in almost every Linux distribution out there. This makes installation not a major issue. In short, you will have to install a package called sysstat since iostat is part of it.
First open your terminal and run one of these commands
#For Debian, Ubuntu and derivatives
sudo apt install sysstat

#For RHEL, Alma Linux and Fedora
sudo dnf install sysstat

#For Arch Linux, Manjaro and derivates
sudo pacman -S sysstat
Now you can use iostat and other tools as well.
Using iostat to monitor the hard disk on Linux
The use is easy, and it all depends on what you need to do with the information obtained.
Get information about all disks Get information about all disks.
If you want to get information about all the disks in the computer, simply run
iostatRemember that this command needs root permissions, so you will have to use sudo or login as root user.
You will get an output similar to this
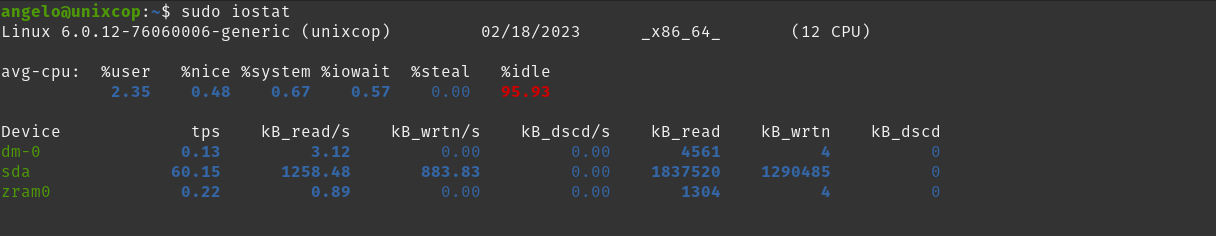
The output is a bit explicit, but let’s break it down.
The first line shows you the kernel, the date the processor and system architecture and finally the number of CPU cores.
Then, the CPU usage percentage:
- While executing at the user level
- While executing at the user level with nice priority
- Also, while executing at the system level (kernel)
- While the percentage of time that the CPU or CPUs were idle during which the system had an outstanding disk I/O request.
Finally, show the percentage of time that the CPU or CPUs were idle, and the system did not have an outstanding disk I/O request.
In the next line, you can select per device:
- TPS: Indicate the number of transfers per second that were issued to the device.
- The rest are read and write statistics per unit of file weight per second.
This way, you can get an idea of what iostat allows you to do.
Display the iostat help.
As iostat is very advanced, it has many options to display its statistics.
The best thing to do then is to take a look at the help that the system displays
iostat --helpSample output
Usage: iostat [ options ] [ <interval> [ <count> ] ]
Options are:
[ -c ] [ -d ] [ -h ] [ -k | -m ] [ -N ] [ -s ] [ -t ] [ -V ] [ -x ] [ -y ] [ -z ]
[ { -f | +f } <directory> ] [ -j { ID | LABEL | PATH | UUID | ... } ]
[ --dec={ 0 | 1 | 2 } ] [ --human ] [ --pretty ] [ -o JSON ]
[ [ -H ] -g <group_name> ] [ -p [ <device> [,...] | ALL ] ]
[ <device> [...] | ALL ]
More uses of iostat
If you want to simplify a bit more the output per screen, you can use the -d option, which only shows statistics for devices connected to the system and not all of them.
iostat -d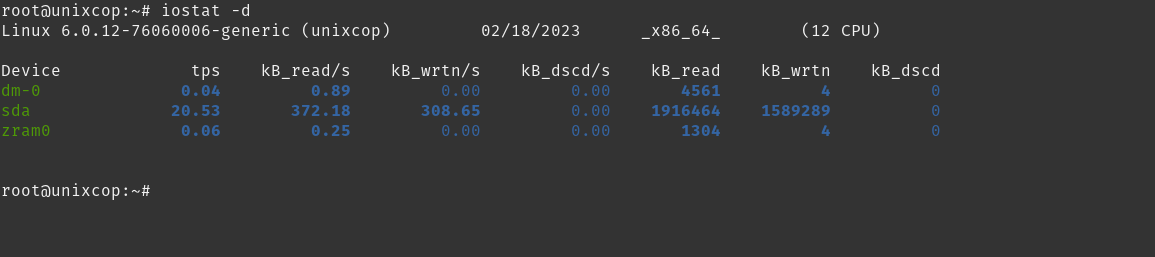
The usual is to use a time and a repetition series. This allows having more approximate and accurate data.
iostat -d 4 2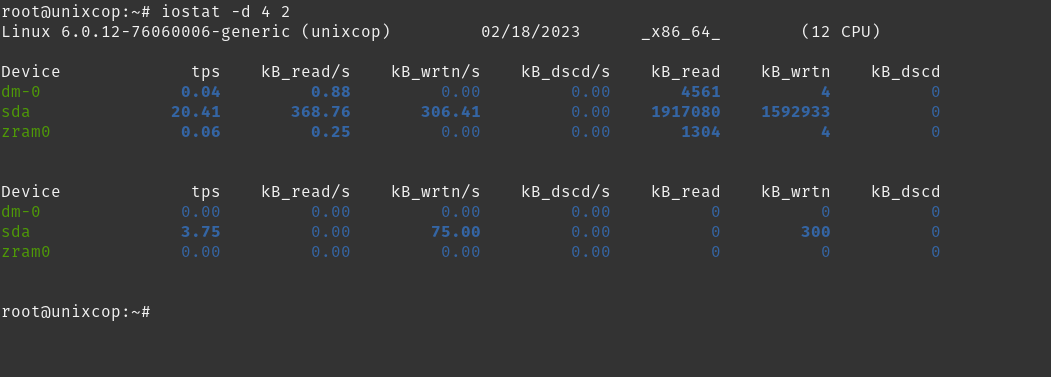
In this case, the monitoring will be done every 4 seconds and with two repetitions.
You can also generate statistics for the CPU only. To do so, run.
iostat -cThis way you will have data only for the CPU and its behavior.
If you want more detailed statistics, then the -x option will give you a more complete output.
iostat -x
Linux 6.0.12-76060006-generic (unixcop) 	02/18/2023 	_x86_64_	(12 CPU)

avg-cpu:  %user   %nice %system %iowait  %steal   %idle
           1.85    0.24    0.45    0.18    0.00   97.28

Device            r/s     rkB/s   rrqm/s  %rrqm r_await rareq-sz     w/s     wkB/s   wrqm/s  %wrqm w_await wareq-sz     d/s     dkB/s   drqm/s  %drqm d_await dareq-sz     f/s f_await  aqu-sz  %util
dm-0             0.03      0.86     0.00   0.00    2.64    25.48    0.00      0.00     0.00   0.00    4.44     0.44    0.00      0.00     0.00   0.00    0.00     0.00    0.00    0.00    0.00   0.01
sda              7.66    361.77     3.12  28.94    2.13    47.21   12.47    301.90    10.83  46.47    1.66    24.21    0.00      0.00     0.00   0.00    0.00     0.00    3.96    1.93    0.04   1.81
zram0            0.06      0.25     0.00   0.00    0.00     4.00    0.00      0.00     0.00   0.00    0.00     4.00    0.00      0.00     0.00   0.00    0.00     0.00    0.00    0.00    0.00   0.00
You can combine the above options to play with the on-screen output. Example
iostat -dxUsing the -p option, you can get the statistics for a particular device. For example:
iostat -p sdaYou can also specify several devices
iostat -p sda, sdbAnd so, you can continue to use it.
Conclusion
iostat is an interesting weapon for many sysadmins and for everyone who wants to manage his computer more and know it better.