")
In this article we will learn How to Use Linux Strace Command. Strace is a powerful command line tool for debugging and trouble shooting programs in Linux OS. It captures and records all system calls made by a process and the signals received by the process.
It displays the name of each system call together with its arguments enclosed in a parenthesis and its return value to standard error; you can optionally redirect it to a file as well.
Normally strace is available by default if its not present in your system install strace by using the following command:
dnf install strace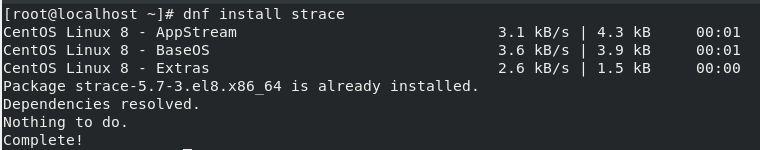
You can either run a command with strace or pass a PID to it using the -p option as in the following examples:
Trace Linux Command System Calls:
In this example we will simply run a command “df -h” followed by strace to track system calls for df -h command.
strace df -hOutput will look like this:
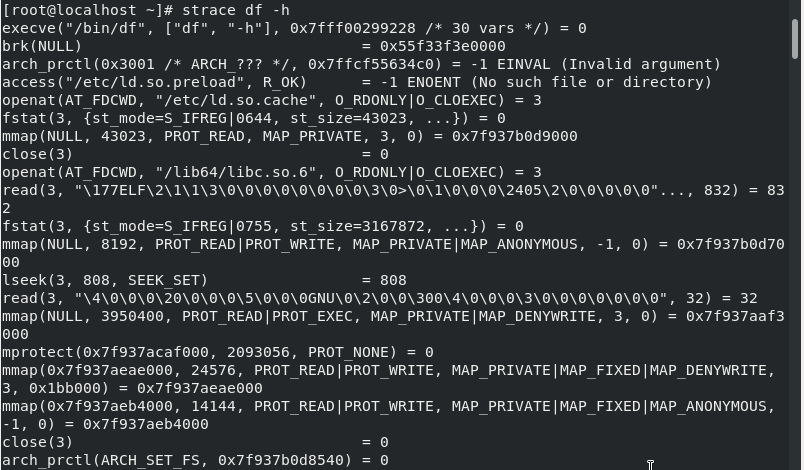
From the output above, you can see various types of system calls made by df -h command, for example “open(“/etc/ld.so.cache”, O_RDONLY|O_CLOEXEC) = 3″
Where,
- open – is the type of system call
- (“/etc/ld.so.cache”, O_RDONLY|O_CLOEXEC) – system call argument
- 3 – system call return value
Trace Linux Process PID:
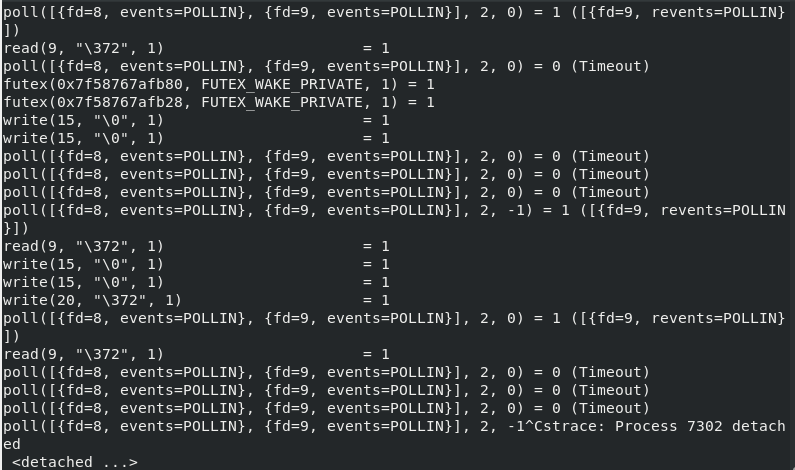
If a process is already running, you can trace it by simply passing its PID to strace; this will fill your screen with continues output that shows system calls being made by the process, to end it, press CTRL + C.
strace -p 7302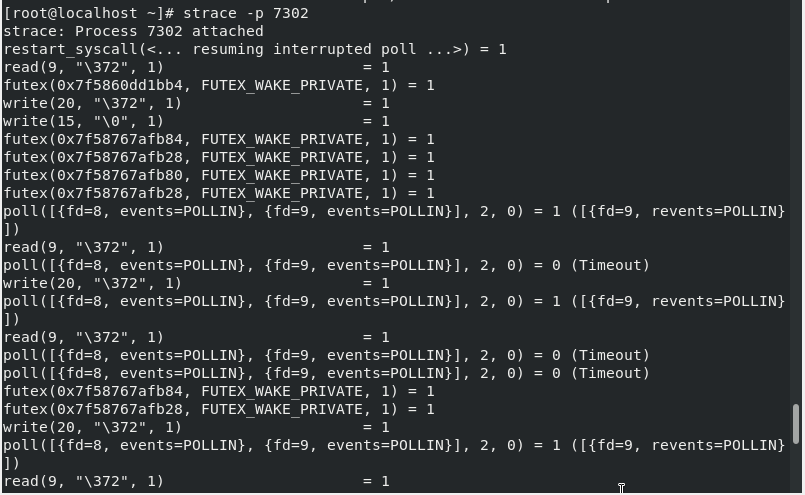
To get a summary of total time, calls and error of a system call use flag -c as shown below;
strace -pc 7583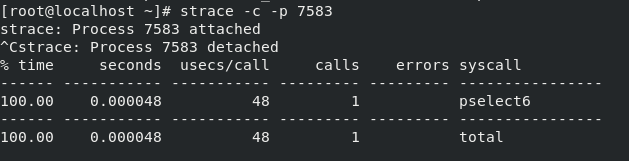
Print Instruction Pointer During System Call:
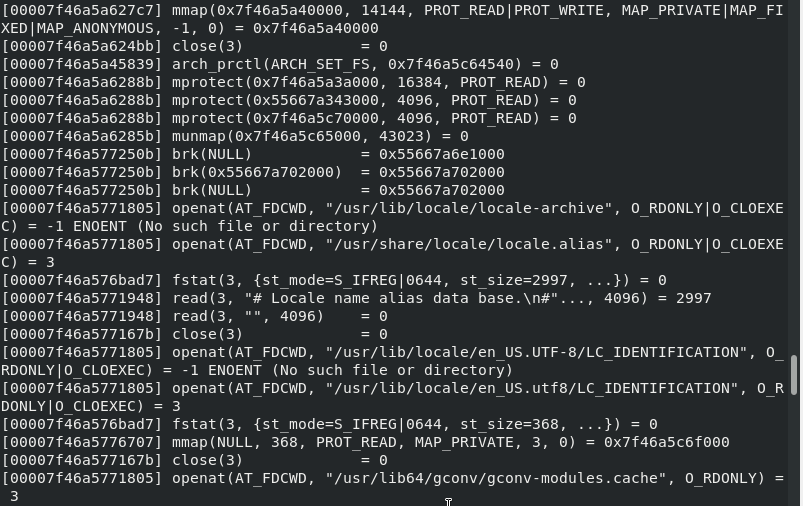
The -i flag displays the instruction pointer at the time of each system call made by the program.
strace -i df -h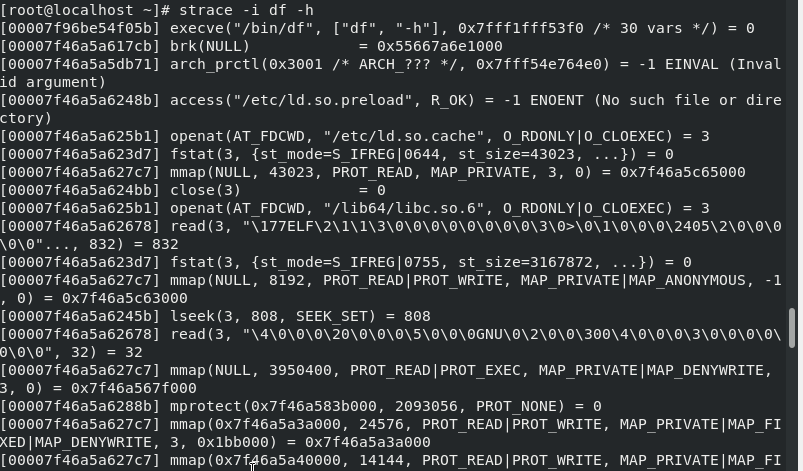
Show Time Each Trace Output Line:
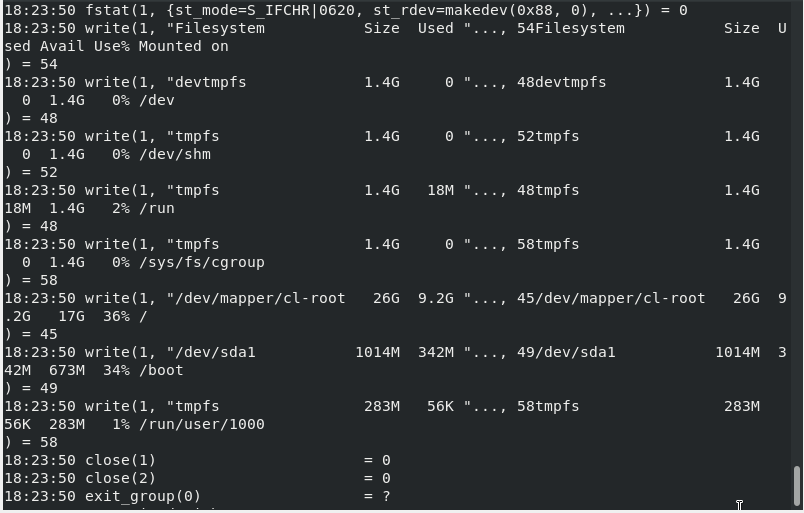
You can also print current time for each line in the trace output, by passing the -t flag.
strace -t df -h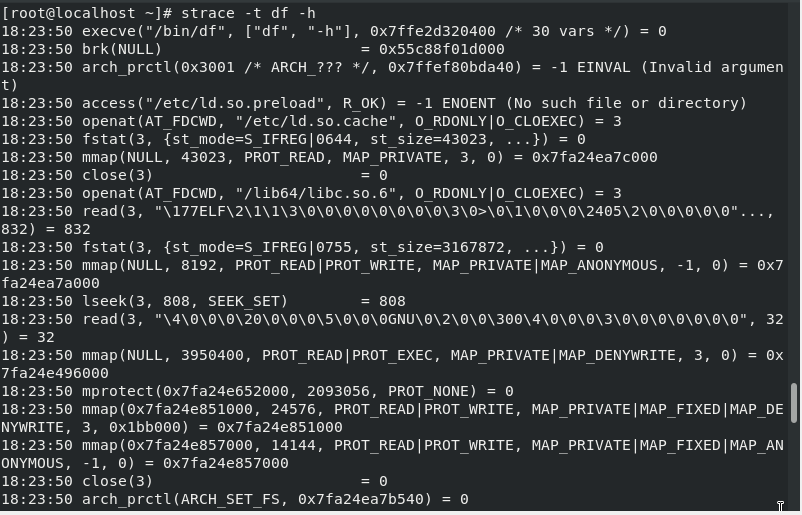
Print Command Time Spent in System Calls:
To shows the time difference between the starting and the end of each system call made by a program, use the -T option.
strace -T df -h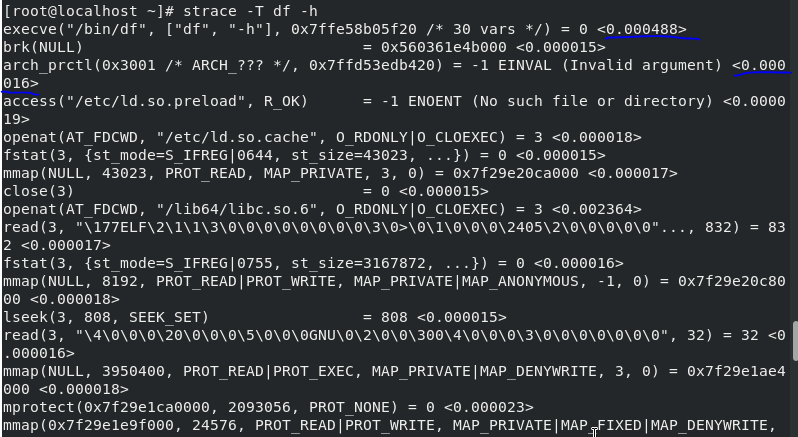
Trace Only Specific System Calls:
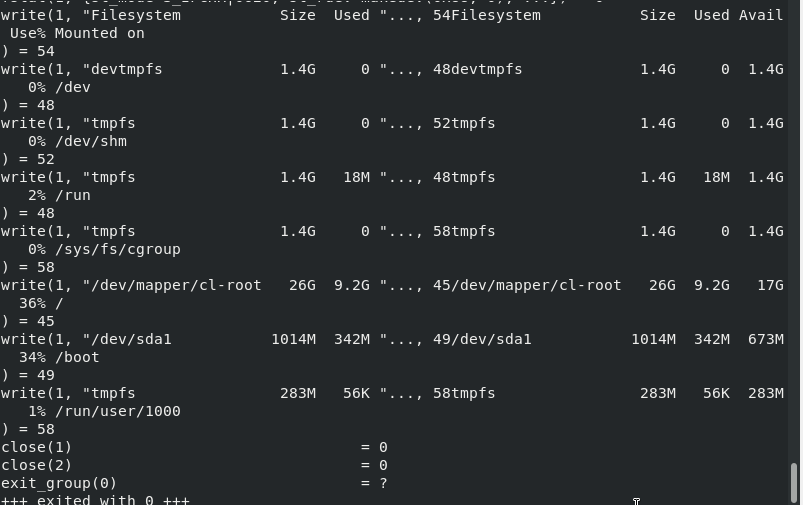
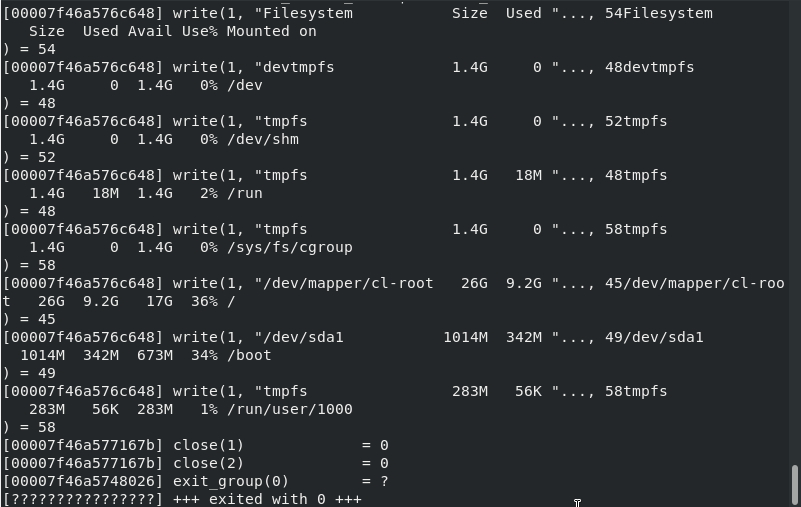
In the command below, trace=write is known as a qualifying expression, where “trace” is a qualifier (others include signal, abbrev, verbose, raw, read, or write) and “write” is the value of the qualifier.
The following command actually shows the system calls to print df -h output on standard output.
strace -e trace=write df -h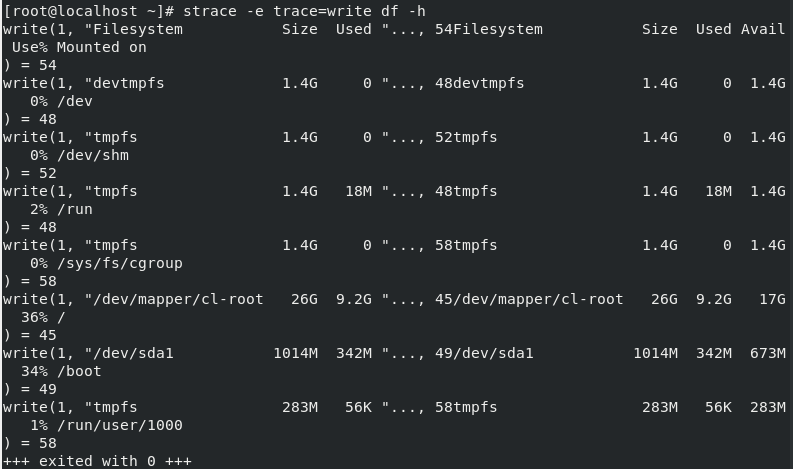
Some additional commands about trace qualifier are as follows:
strace -e trace=open,close df -h
strace -e trace=open,close,read,write df -h
strace -e trace=all df -h
Trace System Calls Based on a Certain Condition:
We will see how to trace system calls relating to a given class of events. The following command can be used to trace all system calls involving process management.
strace -q -e trace=process df -h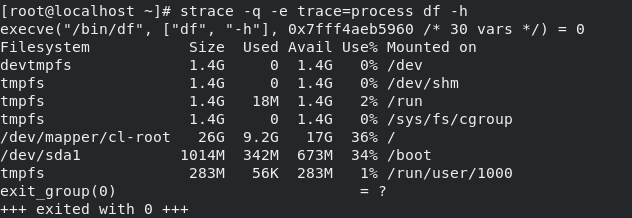
Next, to trace all system calls that take a filename as an argument, use the following command:
strace -q -e trace=file df -h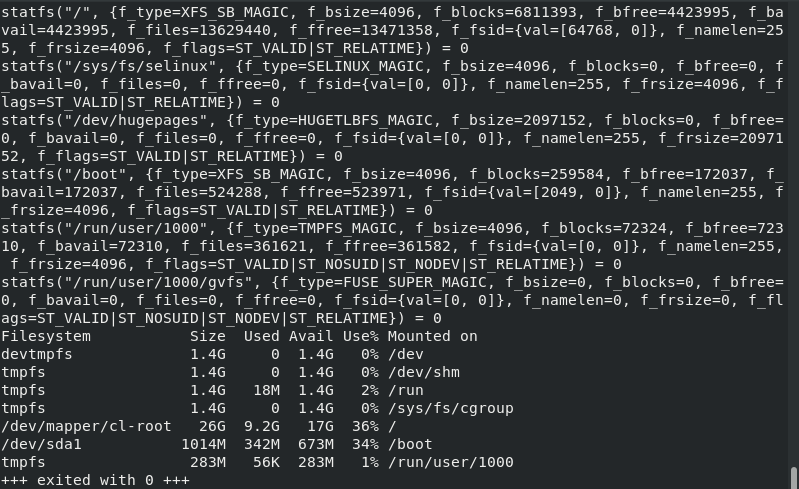
Similarly, You can trace all network, memory and signals related system calls using the following commands:
strace -q -e trace=memory df -h
strace -e trace=network df -h
strace -e trace=signal df -h
Redirect Trace Output to File:
To write the trace messages sent to standard error to a file, use the -o option. This means that only the command output is printed on the screen as shown below.
strace -o strace_message.txt df -h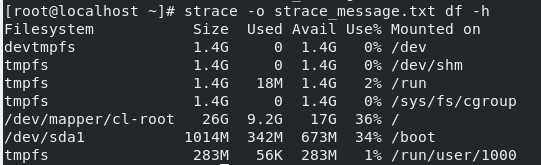
All the system calls were written in file strace_message.txt. Use cat command to see the system calls.
cat strace_message.txt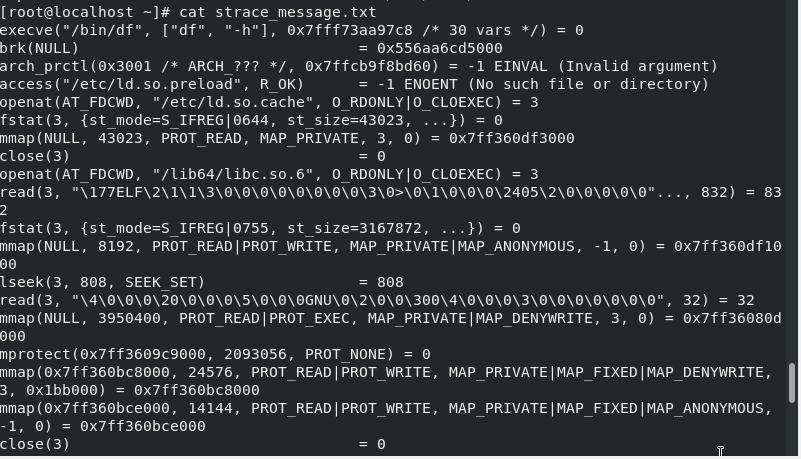
Show Debugging Output of Strace:
To show debugging information for strace tool, use the -d flag.
strace -d df -h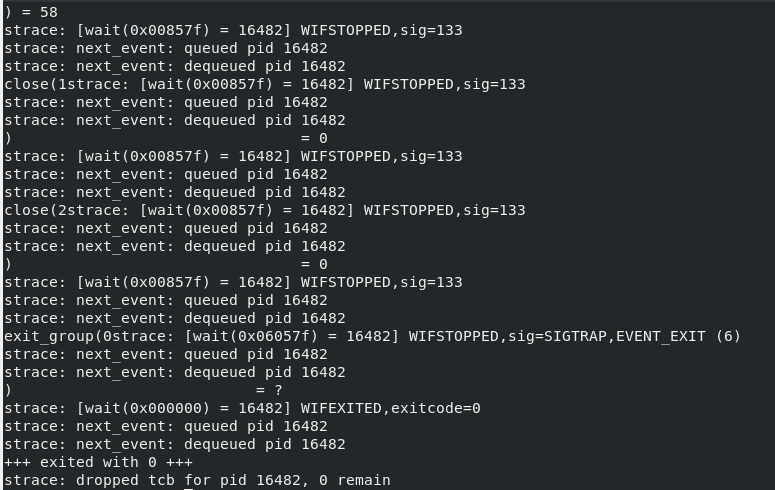
In conclusion, strace is a tool for diagnosing cause of program failure. it is a powerful tool for debugging and troubleshooting. It is practically useful to experienced system administrators, programmers and hackers.