Hello, friends. In this post, you will learn how to analyze network traffic in real-time thanks to iptraf-ng. Let’s go.
iptraf-ng is a console-based network statistic monitoring utility. Thanks to it, you will be able to get useful information from the network. It should be noted that, iptraf-ng is a fork of iptraf and is present in many Linux distributions. The ncurses text-based user interface makes it easy to configure and to use this tool.
It returns such information as:
- Current TCP connections
- UDP, ICMP, OSPF, and other types of IP packets
- Packet and byte counts on TCP connections
- IP, TCP, UDP, ICMP, non-IP, and other packet and byte counts
- TCP/UDP counts by ports
- Packet counts by packet sizes
IPTraf-ng works on Ethernet, FDDI, PLIP, loopback, and SLIP/PPP interfaces. Also supports GRE-over-IP tunnels, 802.1ad and QinQ VLAN, and SIT tunnels.
It is simple to use and manipulate, let’s go for it.
Installing iptraf-ng on Linux
iptraf-ng is present in many Linux distributions. Thanks to its official repositories, this tool can be installed without too many problems.
So, open a terminal or connect via SSH and update your distribution
sudo apt update && sudo apt upgrade
# or
sudo dnf update
# or
sudo zypper up
# or
sudo pacman -Syu
And then you can install it from the official repositories. In the case of Debian, Ubuntu and derivatives.
sudo apt install iptraf-ng
And with this, we will have it installed.
Using iptraf-ng on Linux
To use it, just run its command with root privileges.
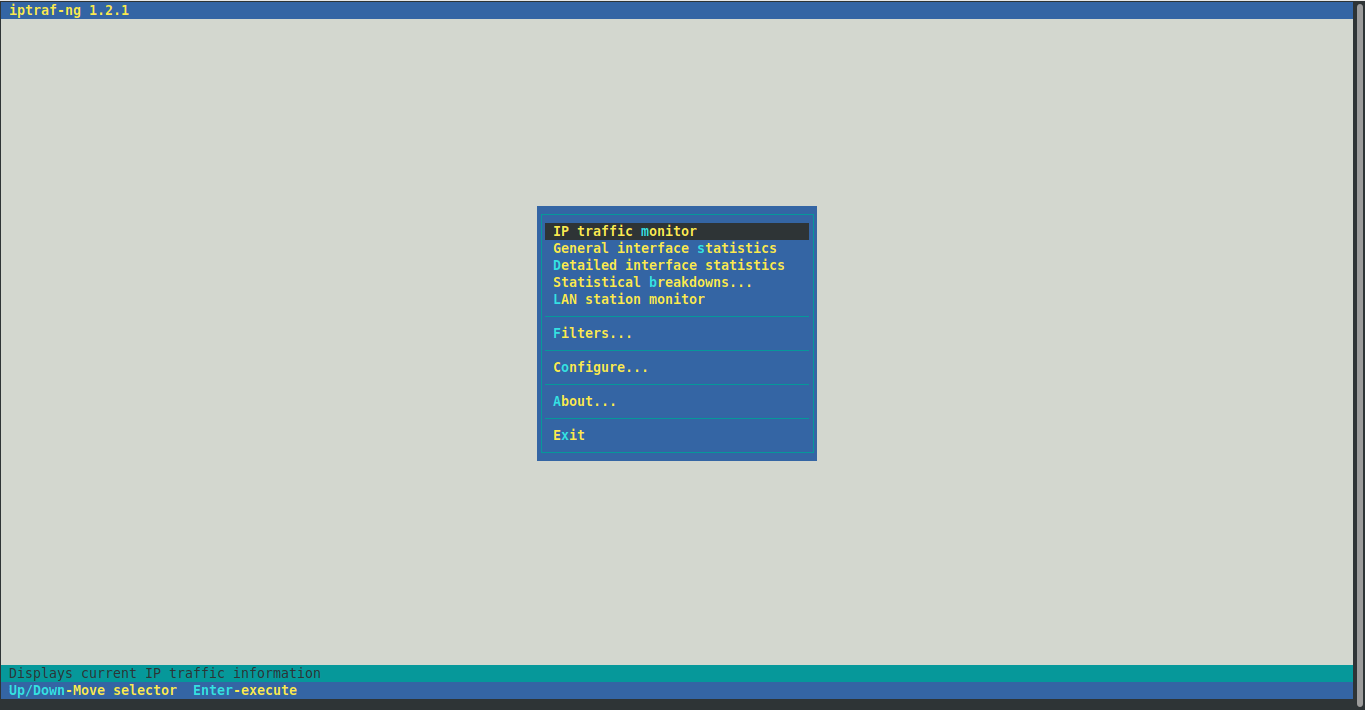
sudo iptraf-ngYou will see a screen like this

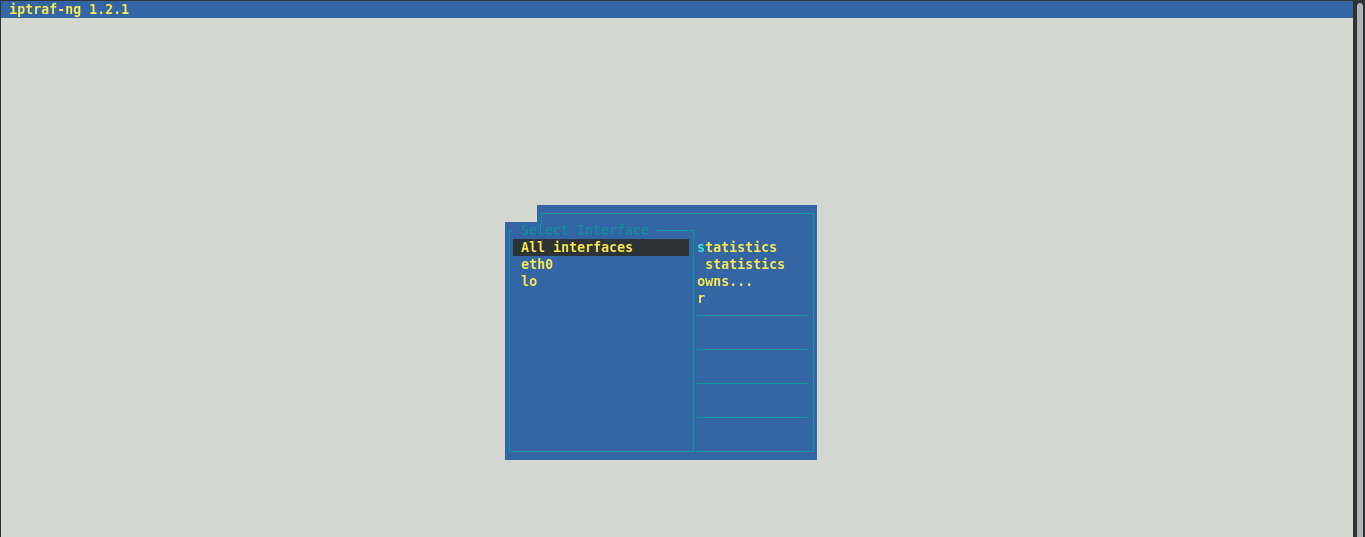
There you will be able to choose the execution mode. For example, you can choose the first option to monitor the network traffic

Finally, you will see the report.

Conclusion
The network is an important issue to consider when using an operating system on a server. So, these tools come to the aid of all sysadmins.


