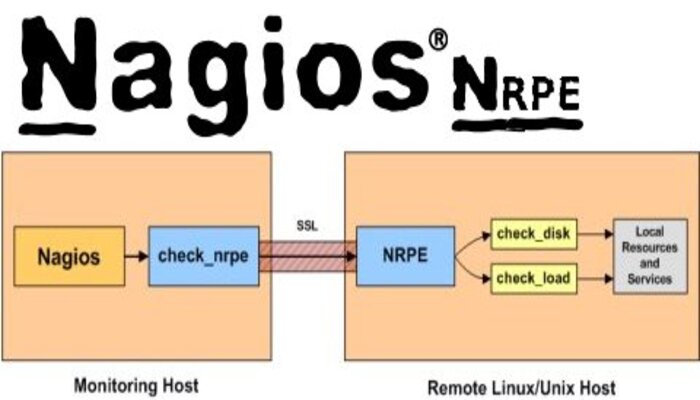
Nagios is a powerful tools that allows you to monitor your IT infrastructure and notify you if any hosts, service or machine specs are malfunctioning. We will see to monitor a linux machine’s basic health check e.g. Current load, Disk Space and Ram Usage etc. in this tutorial. For installation of Nagios and NRPE you can follow our articles using the following link:
How to Install Nagios Core and NRPE on CentOS 8 – Unixcop
I assume that you have installed Nagios and NRPE by following above tutorial. First, we will configure NRPE and then we will add Some configurations in Nagios core to execute check from NRPE for getting data / checks.
NRPE Configuration
Login to the machine whom you want to monitor from Nagios. Make sure you have installed NRPE using the article in the link ” https://unixcop.com/how-to-install-nagios-core-and-nrpe-on-centos-8/ “
Open NRPE configuration file with nano editor:
nano /etc/nagios/nrpe.cfgAllow Nagios core IP in the following line:

Scroll down and set system monitoring commands in configuration file as follows:

save an exit this file and restart nrpe to implement the configuration.
systemctl restart nrpe.service
systemctl status nrpe.service
Nagios Configuration
Login into the machine where Nagios core is installed.
Now follow the procedure mentioned below to configure Nagios to monitor your machine.
Uncomment the following line from “/usr/local/nagios/etc/servers”

Create directory server and enter in that directory where all the check configurations related to monitoring machines will be implemented.
mkdir /usr/local/nagios/etc/servers
nano /usr/local/nagios/etc/servers/machine.cfg
save and exit the file.
Restart Nagios Core
systemctl restart nagios.serviceNow open nagios web and the implemented checks will be visible there.

You can also configure custom check by writing custom plugins using Bash Script in NRPE and then monitor them via Nagios Core.


